 "
"
File:Fig 13-081023-dose responsecurve 100-1.png
From 2008.igem.org
No higher resolution available.
Fig_13-081023-dose_responsecurve_100-1.png (753 × 517 pixels, file size: 7 KB, MIME type: image/png)
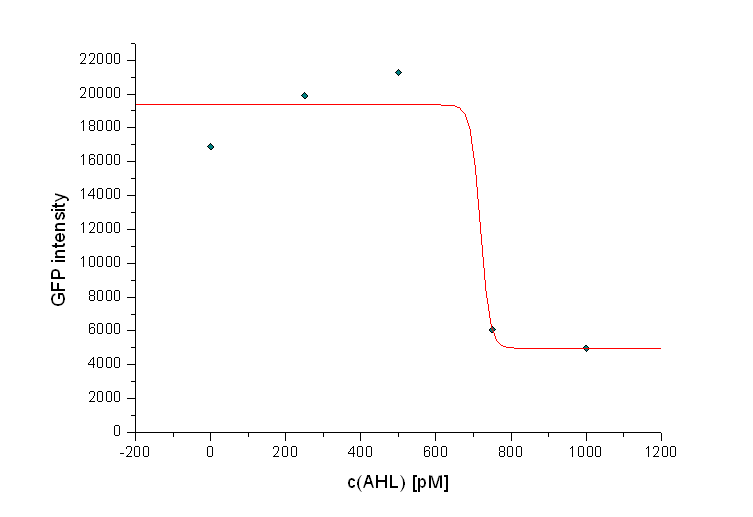
Dose-response curve of AHL concentration and killing efficiency of the killer strain for an prey-killer ratio of 100:1. The GFP intensities at t = 12 h are plotted against AHL concentrations (0 M – 1 nM). For AHL concentrations higher than 600 nM all preys were killed.
File history
Click on a date/time to view the file as it appeared at that time.
| Date/Time | Thumbnail | Dimensions | User | Comment | |
|---|---|---|---|---|---|
| current | 02:01, 29 October 2008 | | 753×517 (7 KB) | Andreaskuehne (Talk | contribs) | (Dose-response curve of AHL concentration and killing efficiency of the killer strain for an prey-killer ratio of 100:1. The GFP intensities at t = 12 h are plotted against AHL concentrations (0 M – 1 nM). For AHL concentrations higher than 600 nM all pr) |
File links
The following 2 pages link to this file: