 "
"
File:Fig 6-081019-GFP-OD combined.png
From 2008.igem.org
Size of this preview: 800 × 259 pixels
Full resolution (1,502 × 486 pixels, file size: 128 KB, MIME type: image/png)
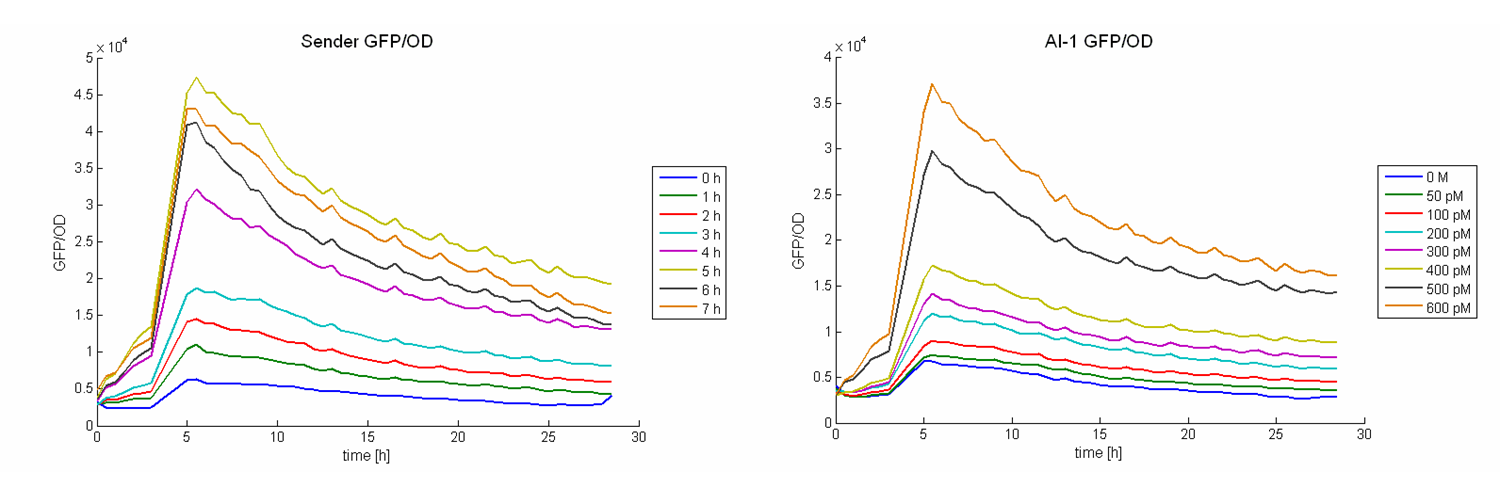
Results of sender activity test. Top left: Growth curve of sender culture. Top right: GFP/OD values of sender supernatants at t = 10 h. Bottom left: GFP/OD – AHL calibration curve. Dotted line visualized regression of an exponential growth curve. Bottom right: Produced AHL concentrations of the sender cells.
File history
Click on a date/time to view the file as it appeared at that time.
| Date/Time | Thumbnail | Dimensions | User | Comment | |
|---|---|---|---|---|---|
| current | 01:48, 29 October 2008 | 1,502×486 (128 KB) | Andreaskuehne (Talk | contribs) | (Results of sender activity test. Top left: Growth curve of sender culture. Top right: GFP/OD values of sender supernatants at t = 10 h. Bottom left: GFP/OD – AHL calibration curve. Dotted line visualized regression of an exponential growth curve. Botto) |
File links
There are no pages that link to this file.