 "
"
File:Fig 7-081028-sender test GFP-OD.png
From 2008.igem.org
Size of this preview: 800 × 272 pixels
Full resolution (1,502 × 510 pixels, file size: 129 KB, MIME type: image/png)
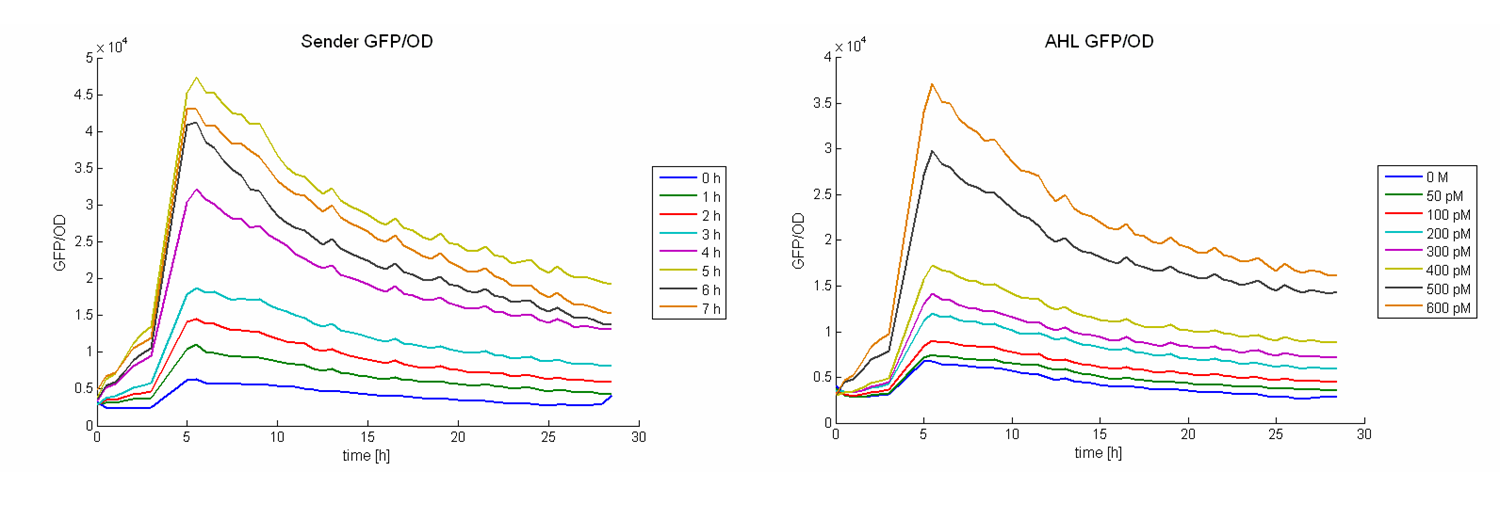
GFP/OD results of sender activity measurements. On The left panel the GFP/OD values for induction with sender supernatants are shown and on the right panel the GFP/OD values for predefined AHL inductions can be observed. During the first sic hours the values increase and reach a maximum until the decrease slightly. The values at t = 10 h were used for calculations of AHL concentrations in supernatants.
File history
Click on a date/time to view the file as it appeared at that time.
| Date/Time | Thumbnail | Dimensions | User | Comment | |
|---|---|---|---|---|---|
| current | 01:49, 29 October 2008 | 1,502×510 (129 KB) | Andreaskuehne (Talk | contribs) | (GFP/OD results of sender activity measurements. On The left panel the GFP/OD values for induction with sender supernatants are shown and on the right panel the GFP/OD values for predefined AHL inductions can be observed. During the first sic hours the val) |
File links
The following 2 pages link to this file: