TUDelft/24 October 2008
From 2008.igem.org
| July | ||||||
| M | T | W | T | F | S | S |
| 1 | 2 | 3 | 4 | 5 | 6 | |
| 7 | 8 | 9 | 10 | 11 | 12 | 13 |
| 14 | 15 | 16 | 17 | 18 | 19 | 20 |
| 21 | 22 | 23 | 24 | 25 | 26 | 27 |
| 28 | 29 | 30 | 31 | |||
| August | ||||||
| M | T | W | T | F | S | S |
| 1 | 2 | 3 | ||||
| 4 | 5 | 6 | 7 | 8 | 9 | 10 |
| 11 | 12 | 13 | 14 | 15 | 16 | 17 |
| 18 | 19 | 20 | 21 | 22 | 23 | 24 |
| 25 | 26 | 27 | 28 | 29 | 30 | 31 |
| September | ||||||
| M | T | W | T | F | S | S |
| 1 | 2 | 3 | 4 | 5 | 6 | 7 |
| 8 | 9 | 10 | 11 | 12 | 13 | 14 |
| 15 | 16 | 17 | 18 | 19 | 20 | 21 |
| 22 | 23 | 24 | 25 | 26 | 27 | 28 |
| 29 | 30 | |||||
| October | ||||||
| M | T | W | T | F | S | S |
| 1 | 2 | 3 | 4 | 5 | ||
| 6 | 7 | 8 | 9 | 10 | 11 | 12 |
| 13 | 14 | 15 | 16 | 17 | 18 | 19 |
| 20 | 21 | 22 | 23 | 24 | 25 | 26 |
| 27 | 28 | 29 | 30 | 31 | ||
October 24th
Sending parts
Today we sent our lyophilized DNA to MIT. We also sent a number of strains to Baseclear (NL) for sequencing.
Protein Precipitation
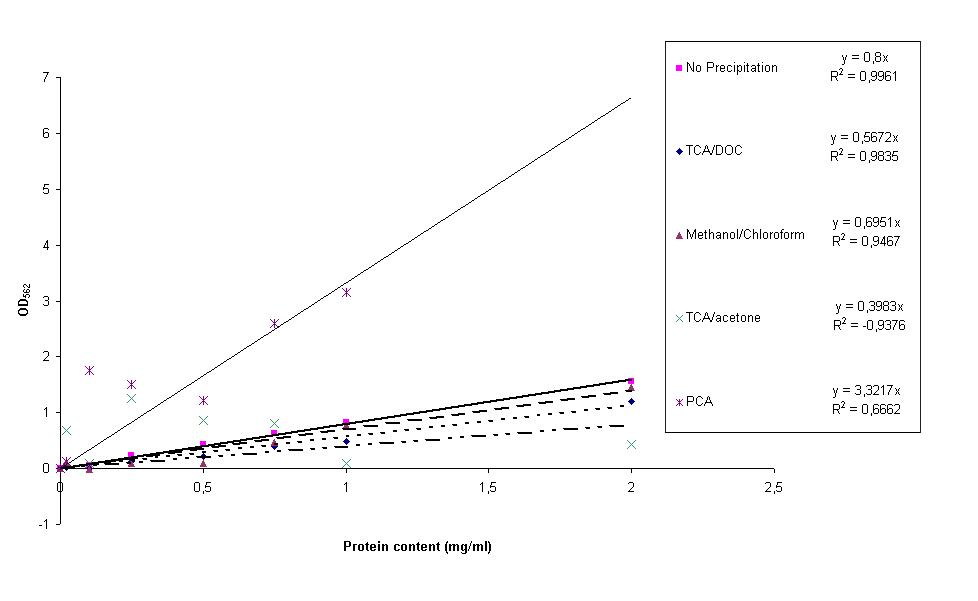
Including yesterday's PCA precipitation, four different protein precipitation protocols were conducted to obtain protein content measurements without the disturbance of lysis buffer. The four protocols can be found here, they are PerChloric Acid (PCA), TriChloroAcetic acid (TCA)/acetone, TCA/Deoxycholate (DOC) and methanol/chloroform precipitation. For each of these precipitation methods four samples of constructs BBa_K115012, BBa_K115035 and BBa_K115036 and the calibration curve (bovine serum albumin in H2O) were resuspended in 1x lysis buffer. After precipitation protocol and BCA assay was performed, standard calibration curves were made for all four precipitation protocols together with an untreated calibration curve for comparative reasons. The result can be seen in figure 1.
It is clear from figure 1 that the PCA and acetone/TCA calibration curves are really bad. This can be due to incomplete removal of the lysis buffer and/or differences in precipitation efficiency from sample to sample. The methanol/chloroform standard curve is already much better, but still not good enough for accurate experimentation. The TCA/DOC standard curve can be considered all right. However, a lot of the construct samples measured in this experiment for all precipitation methods gave back negative protein contents. A reason for this could be that protein precipitation in complex (cell extracts) samples takes longer than for simple (calibration curve) samples. During the experiments the shortest incubation periods possible were taken, this could be the reason we did not measure protein content. These protocols won't be used.
 "
"
