Team:Brown/Project/Testing
From 2008.igem.org
Apparatus DesignTeam Toxipop started off the summer focusing on measuring changes in resistance. Much of our summer work was devoted to the construction of an electrical circuit and measuring apparatus unique to our purpose. Many additions were made to the apparatus each week. Below, you will find information about the different "versions" of the apparatus including final information about our switch to conductivity.
Design V1Our first apparatus design was rather simple. We started with a voltmeter and a Gorillapod. We believed the Voltmeter would allow us to measure changes in resistance over time as our cells lysed. The probes of the voltmeter were attached to the Gorillapod, thus fixing the distance between them. The cell solution was contained in a Petri dish into which the probes were lowered. Problems:The petri dish setup only allowed us to do one test at a time. Also, having to keep the entire dish open for hours on end allowed for evaporation of the solution, thus changing the volume and affecting the resistance measurements. It was also difficult to ensure that the probes were exactly the same distance apart between tests.
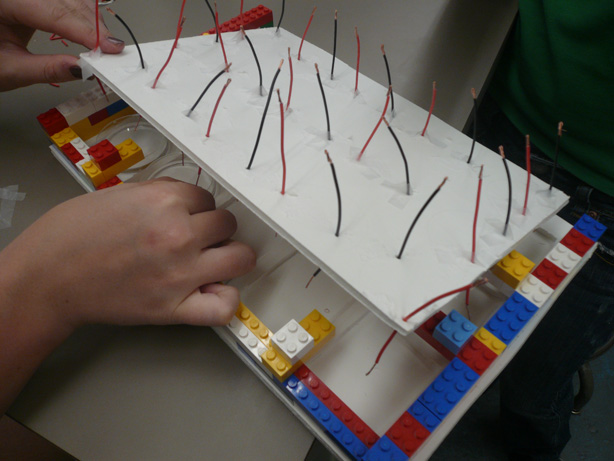
Design V2We moved to a second apparatus that fixed many of the problems we saw with Design V1. We added room for many wells, to allow for multiple tests in parallel. We also placed copper wire in each well to try and keep the electrode distance constant. Our second apparatus was made with Legos and poster board. At this point we only had a standard voltmeter that could detect large resistance changes between different salt solutions. The changes we expected to see, however, were on a much smaller scale, as determined by our mathematical calculations. Problems: The copper wire was not stiff and would not stay at a fixed distance. We believed the voltmeter was not sensitive enough to detect magnitude of changes we were looking for. A major problem turned out to be that the voltmeter was outputting a DC (direct current) signal, which combined with copper electrodes, allowed for Redox chemistry. This led to very inconsistent readings.
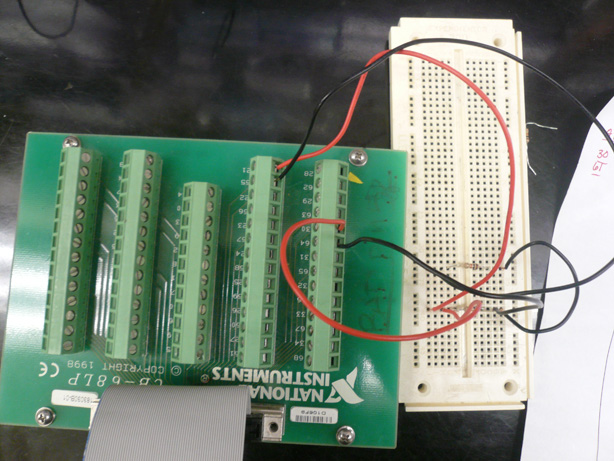
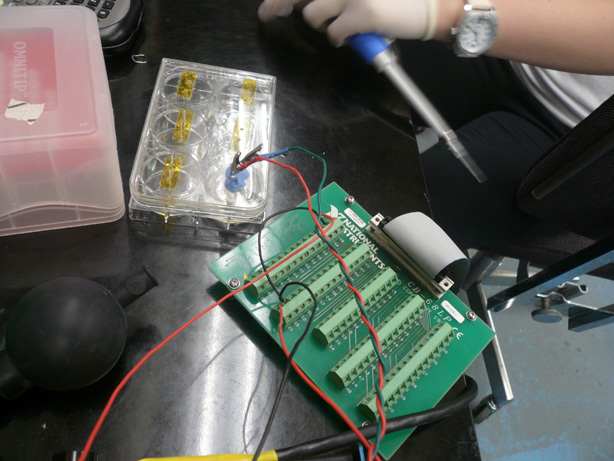
Design V3Having calculated the amount of E. coli bacteria cells expected in each sample and the corresponding net ionic content, we found that these values could not be accurately measured with a standard voltmeter. In addition, the electrodes of the first apparatus did not remain stationary and were difficult to manage. They were made of a Copper alloy and were multi-stranded. The copper was most likely performing redox chemistry. The DNA and other charged particles released from the cells collected on the wires throughout the experiment. We designed a new system featuring a Data Acquisition Card, circuit board, amplifiers, and a LabView computer program to collect the data. The new apparatus and computer software permitted us to control the voltage being output into solution as well as the type of current (AC or DC). We elected to output an alternating current to keep the charged particles from flowing to one electrode. We also elected to output a very low voltage in order to keep the cells from electroporating. Significant Changes: Used a six well plate and PDMS (plastic) mold and embedded platinum wires. By using an inert metal we were able to avoid redox chemistry and by using a cast mold, we were able to keep the distances between the electrodes fixed. Problems: After significant testing, we came to the realization that our measurement algorithm and setup would not allow for sufficiently consistent and accurate results in the form of resistance measurements. Having spent nearly 2 months designing and testing this system, we decided to cut our losses and try to find another solution.
Final Design
From Vernier's website: You can take readings in units of conductivity (µS/cm) or concentration (mg/L TDS as NaCl). The Conductivity Probe can monitor conductivity at three different sensitivity settings:
Cell Lysis Testing
|
 "
"


