Team:NTU-Singapore/Modelling/Parameter/LysisaD
From 2008.igem.org
(Difference between revisions)
Lalala8585 (Talk | contribs) (New page: <html><link rel="stylesheet" href="http://greenbear88.googlepages.com/ntu_igem.css" type="text/css"></html> <div id="header">{{User:Greenbear/sandbox/header}}</div> <div id="maincontent"...) |
Lalala8585 (Talk | contribs) |
||
| Line 37: | Line 37: | ||
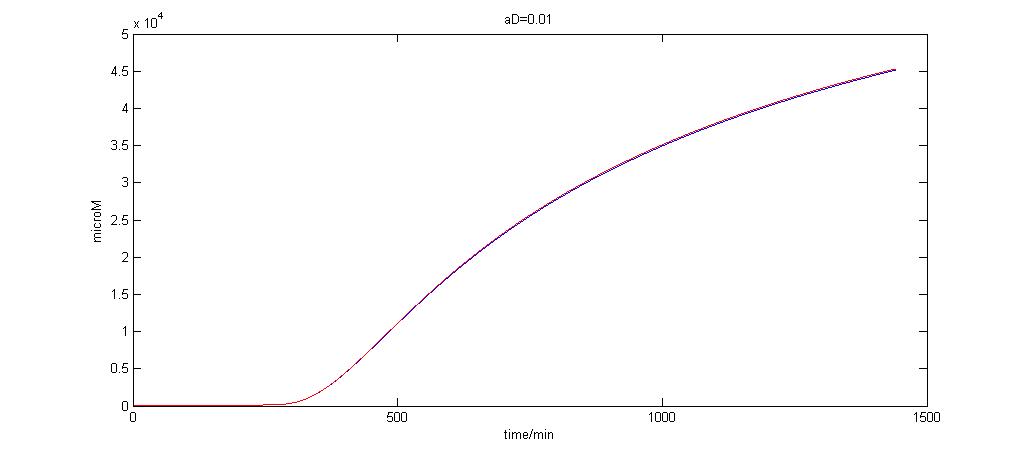
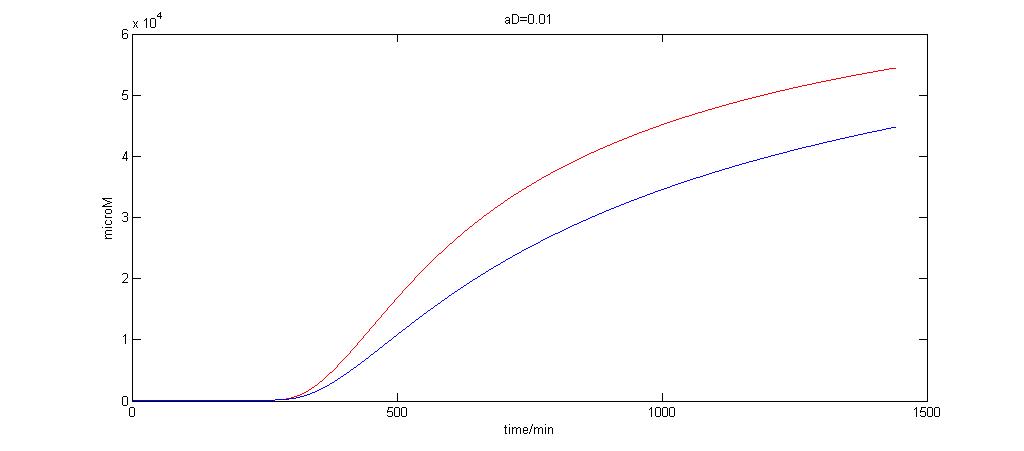
[[Image:nd=100AD=0.01.jpg|600px| aD=0.01]]<br> | [[Image:nd=100AD=0.01.jpg|600px| aD=0.01]]<br> | ||
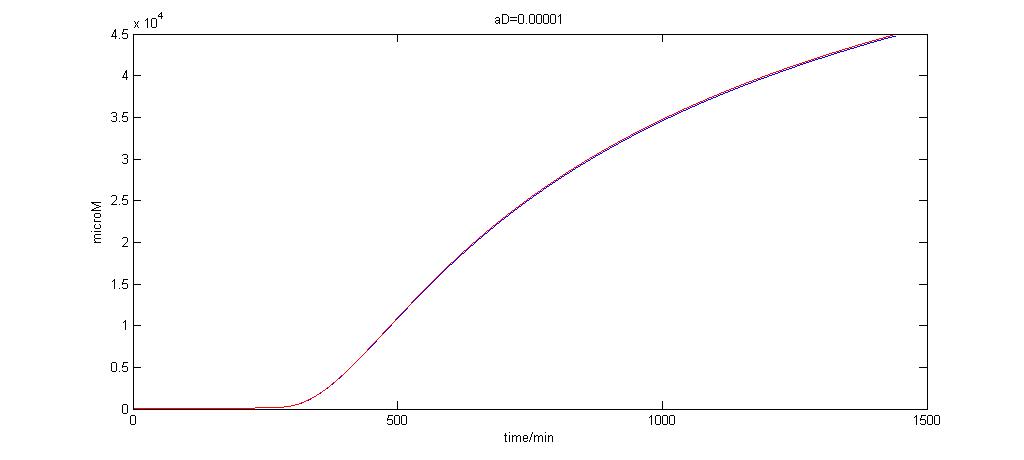
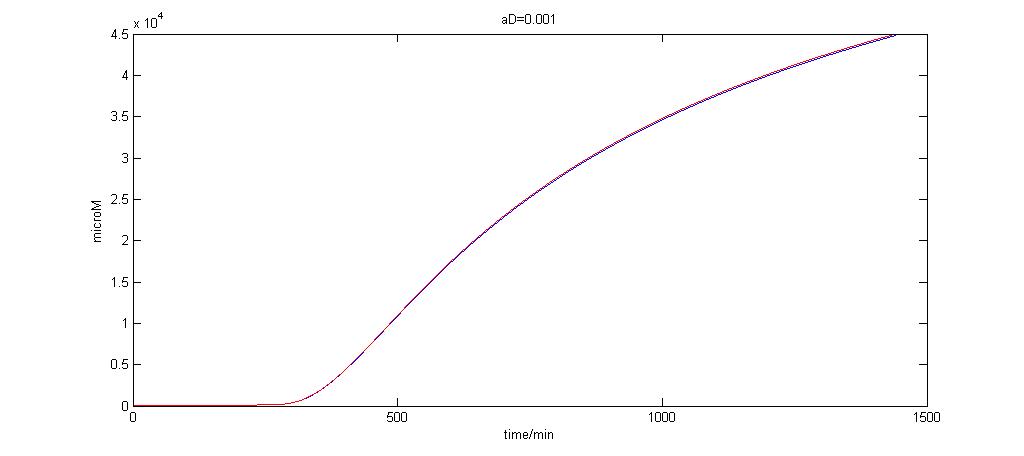
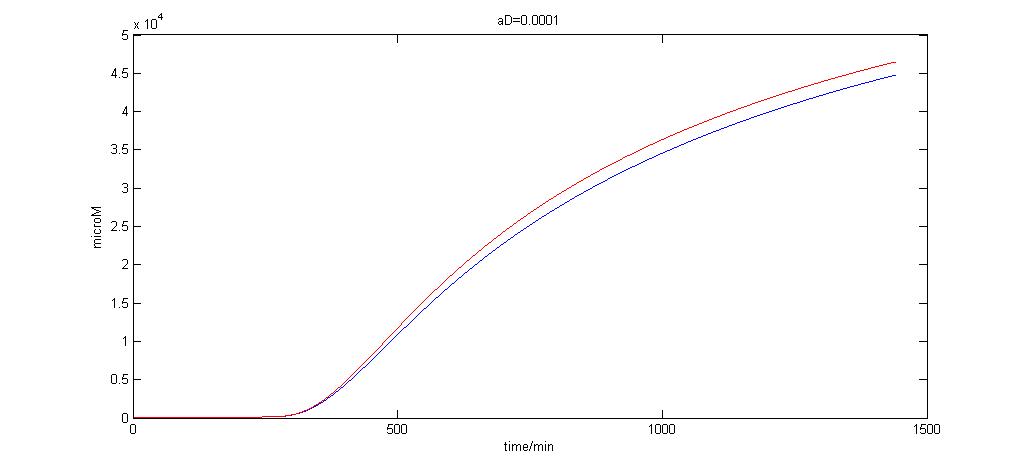
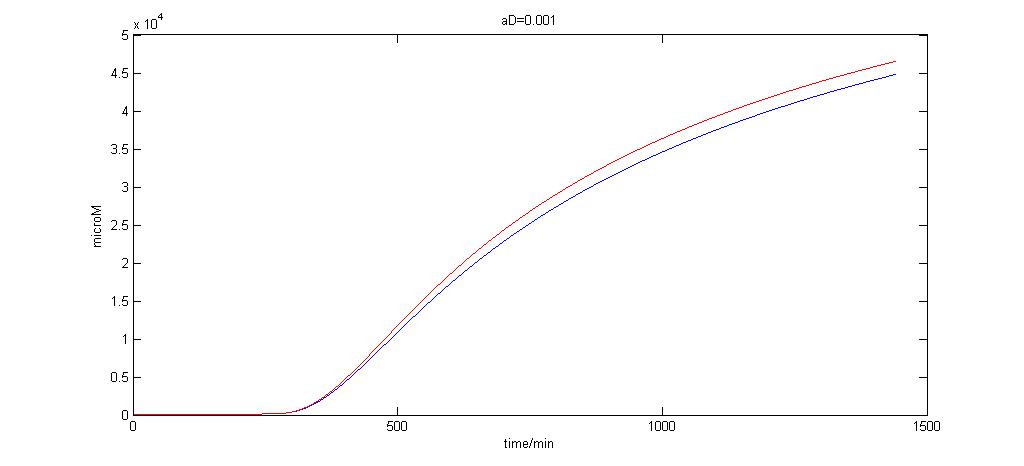
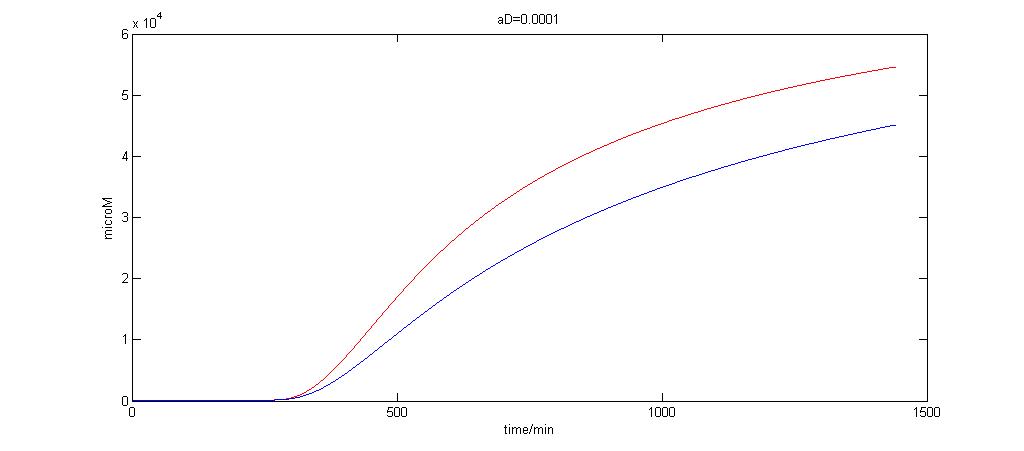
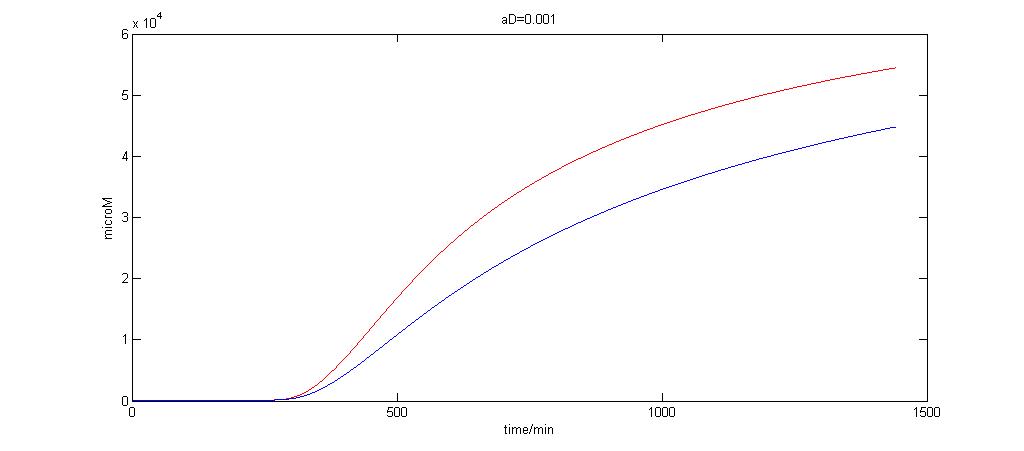
| - | The graph presents a range of values | + | The graph presents a range of values aD can take on |
Revision as of 02:29, 1 July 2008
|
 "
"

