Team:Tokyo Tech
From 2008.igem.org
(→Result ~ activity of Ptet ~) |
(→3. Touch display) |
||
| (46 intermediate revisions not shown) | |||
| Line 13: | Line 13: | ||
| - | == <font size=5>'''1 Our project''' </font>== | + | == <font size=5>'''1. Our project''' </font>== |
<html> | <html> | ||
| Line 54: | Line 54: | ||
<td class="a"> | <td class="a"> | ||
| - | <p><div>What is "<i style='mso-bidi-font-style:normal'>Coli</i> touch"?</div></p> | + | <p><div><b>What is "<i style='mso-bidi-font-style:normal'>Coli</i> touch"?</b></div></p> |
<div>“<i style='mso-bidi-font-style:normal'>Coli</i> Touch” has a pressure sensitive display composed of an <i style='mso-bidi-font-style:normal'>E. coli</i> lawn. When you touch its display, touched section is colored.</div> | <div>“<i style='mso-bidi-font-style:normal'>Coli</i> Touch” has a pressure sensitive display composed of an <i style='mso-bidi-font-style:normal'>E. coli</i> lawn. When you touch its display, touched section is colored.</div> | ||
| - | <div>Next I'll tell you about “<i style='mso-bidi-font-style:normal'>Coli</i> Touch” work system. Display of “<i style='mso-bidi-font-style:normal'>Coli</i> Touch” | + | <div>Next I'll tell you about “<i style='mso-bidi-font-style:normal'>Coli</i> Touch” work system. Display of “<i style='mso-bidi-font-style:normal'>Coli</i> Touch” contains many <i style='mso-bidi-font-style:normal'>E. coli</i>. When you touch this display, pressure applies to <i style='mso-bidi-font-style:normal'>E. coli</i> in this display. Pressure applied <i style='mso-bidi-font-style:normal'>E. coli</i> expresses GFP. |
| - | </div><p><div>Why pressure?</div></p> | + | </div><p><div><b>Why pressure?</b></div></p> |
| - | <p><div>“<i style='mso-bidi-font-style:normal'>Coli</i> Touch” uses pressure as input. Why we use pressure | + | <p><div>“<i style='mso-bidi-font-style:normal'>Coli</i> Touch” uses pressure as input. Why do we use pressure? Past input methods (small molecules, heat and light) are difficult to induce uniformly. |
| - | Pressure | + | Pressure can induce uniformly. |
</div></p> | </div></p> | ||
| Line 70: | Line 70: | ||
</html> | </html> | ||
| - | == <font size=5>'''2 Pressure induction'''</font> == | + | == <font size=5>'''2. Pressure induction'''</font> == |
| - | + | <font size=3>'''Introduction'''</font> | |
<html> | <html> | ||
| Line 80: | Line 80: | ||
<td class="a" width="2%"> </td> | <td class="a" width="2%"> </td> | ||
<td class="a"> | <td class="a"> | ||
| - | <div> | + | <div>Tet promoters is known as a sensitive ones to pressure. (T. Sato et al., 1995)</div><td> |
</tr> | </tr> | ||
</table> | </table> | ||
| Line 86: | Line 86: | ||
</html> | </html> | ||
| - | + | <font size=3>'''Construction'''</font> | |
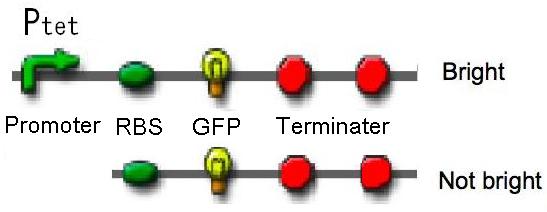
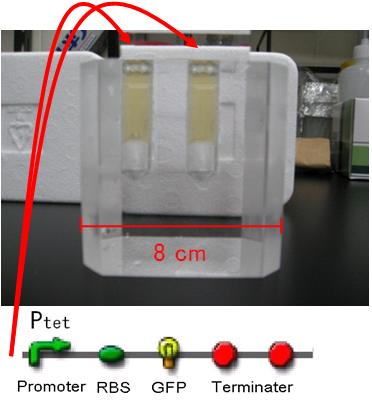
| - | [[Image:Tech_Tet_figure1.jpg|400px|thumb|right|figure2-1. We constructed Ptet-GFP and promoter less-GFP | + | [[Image:Tech_Tet_figure1.jpg|400px|thumb|right|figure2-1. We constructed Ptet-GFP and promoter less-GFP.]] |
<html> | <html> | ||
<body> | <body> | ||
| Line 97: | Line 97: | ||
<td class="a" width="3%"> </td> | <td class="a" width="3%"> </td> | ||
<td class="a"> | <td class="a"> | ||
| - | <div> We chose tet promoter(Ptet) as pressure-inducible promoter. We constructed two plasmids - one is Ptet-GFP on <a href="http://partsregistry.org/Part:BBa_I739201">pSB6</a>. The other is promoter less-GFP on <a href="http://partsregistry.org/Part:BBa_I739201">pSB6</a> as a negative control.We | + | <div> We chose the tet promoter (Ptet) as a pressure-inducible promoter. We constructed two plasmids - one is Ptet-GFP on <a href="http://partsregistry.org/Part:BBa_I739201">pSB6</a>. The other is promoter less-GFP on <a href="http://partsregistry.org/Part:BBa_I739201">pSB6</a> as a negative control. We measured activity of tet promoters under 0.1 MPa and 30 MPa without repressor protein.</div></td> |
</tr> | </tr> | ||
</table> | </table> | ||
| Line 111: | Line 111: | ||
{{clear}} | {{clear}} | ||
| - | + | <font size=3>'''Result -activity of tet promoters- '''</font> | |
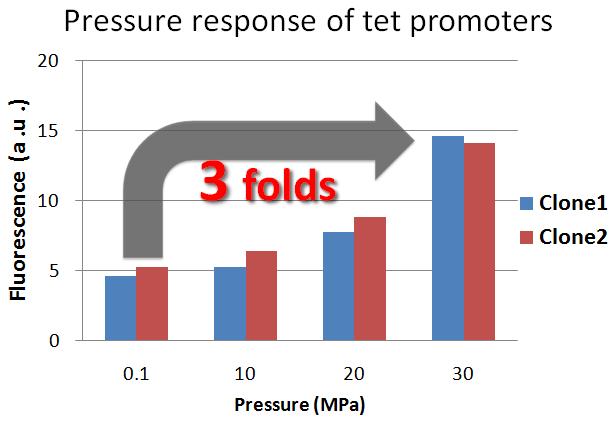
| - | [[Image:Tech Pressure response of tet promoter1.jpg|450px|thumb|right|figure2-2. Pressure response of | + | [[Image:Tech Pressure response of tet promoter1.jpg|450px|thumb|right|figure2-2. Pressure response of the tet promoter without repressor protein. Tet promoters' activity increased under 30 MPa]] |
<html> | <html> | ||
<body> | <body> | ||
| Line 120: | Line 120: | ||
<td class="a" width="2%"> </td> | <td class="a" width="2%"> </td> | ||
<td class="a"> | <td class="a"> | ||
| - | <div>The result shows that | + | <div>The result shows that the tet promoter activity under 30 MPa, without repressor protein, is about 3-fold stronger than the tet promoter activity under 0.1 MPa. Therefore, we confirmed that the tet promoter was induced under 30 MPa.</div><td> |
</tr> | </tr> | ||
</table> | </table> | ||
| Line 141: | Line 141: | ||
<p> </p> | <p> </p> | ||
| - | == <font size=5>'''3 Touch display'''</font> == | + | == <font size=5>'''3. Touch display'''</font> == |
| - | + | <font size=3>'''Touch display''' (plan)</font> | |
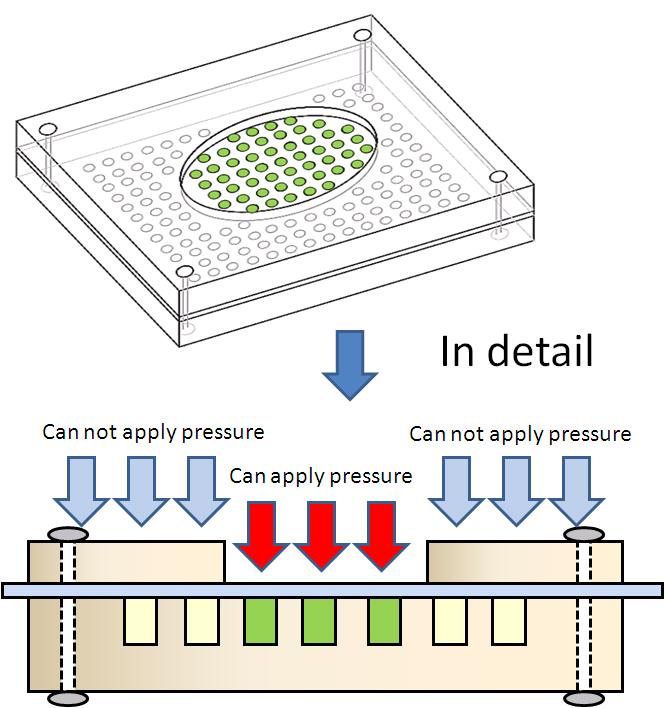
[[image:Tech Pressure device2.jpg|right|400px|thumb|figure 3-1-b. Design of touch display]] | [[image:Tech Pressure device2.jpg|right|400px|thumb|figure 3-1-b. Design of touch display]] | ||
| Line 153: | Line 153: | ||
<td class="a" width="2%"> </td> | <td class="a" width="2%"> </td> | ||
<td class="a"> | <td class="a"> | ||
| - | <div>Touch display | + | <div>Touch display which we planned has many holes, and <i>E. coli</i> is in these holes.(figure 3-1 a)<div> |
| - | <div>As the first step of creating the touch display,we created Prototype touch display. figure 3-1 b)</div> | + | <div>As the first step of creating the touch display, we created Prototype touch display. figure 3-1 b)</div> |
</p></td> | </p></td> | ||
| Line 168: | Line 168: | ||
{{clear}} | {{clear}} | ||
| - | + | <font size=3>'''Prototype touch display'''</font> | |
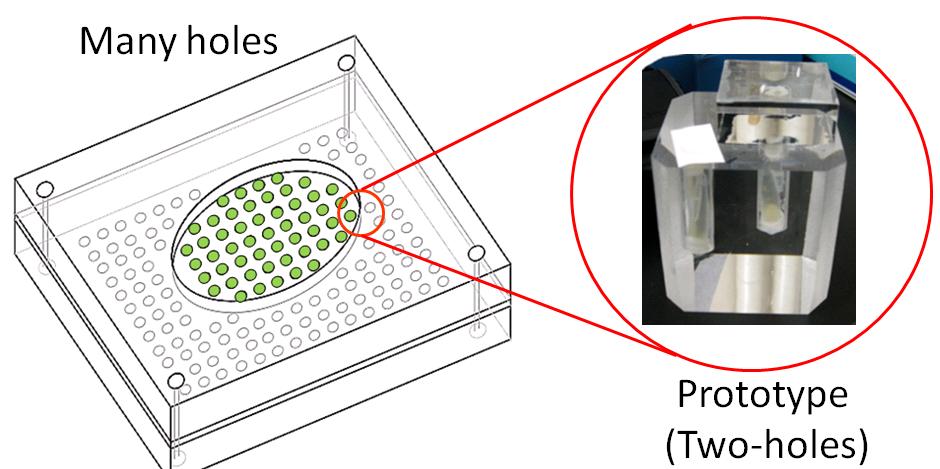
[[image:Tech_aqulyl2.JPG|right|450px|thumb|figure 3-2. Prototype touch display. The display has two kinds of holes and two kinds of covers. ]] | [[image:Tech_aqulyl2.JPG|right|450px|thumb|figure 3-2. Prototype touch display. The display has two kinds of holes and two kinds of covers. ]] | ||
| Line 179: | Line 179: | ||
<td class="a" width="2%"> </td> | <td class="a" width="2%"> </td> | ||
<td class="a"> | <td class="a"> | ||
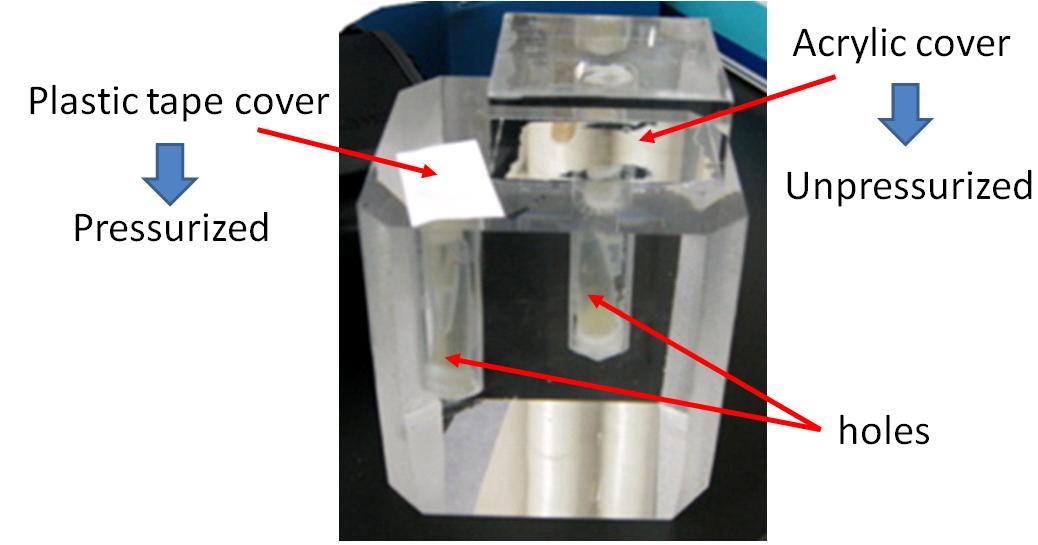
| - | < | + | <div class=MsoNormal>We created a Prototype touch display made of acrylic glasses. This touch display has two kinds of holes(show figure 3-2). Each hole contains culture medium and <i>E. coli</i> is cultivated in these holes. One hole (A) can be pressurized, because the hole is covered with only a plastic tape. Water pressure conducts into the hole.</div> |
| + | <div>The other (B) is not pressurized, because the hole is covered with a block made of acrylic glasses. Water pressure doesn’t conduct into the hole.</font></div> | ||
<td class="a" width="3%"> </td> | <td class="a" width="3%"> </td> | ||
</tr> | </tr> | ||
| Line 189: | Line 190: | ||
[[image:Tech_aqulyl1.jpg|left|thumb|800px|figure 3-3. Touch display. We pour culture medium into the holes.]] | [[image:Tech_aqulyl1.jpg|left|thumb|800px|figure 3-3. Touch display. We pour culture medium into the holes.]] | ||
<p> </p> | <p> </p> | ||
| - | <p> </p><p> </p><p> </p><p> </p><p> </p><p> </p><p> </p><p> </p><p> </p><p> </p><p> </p><p> </p><p> </p><p> </p><p> </p><p> </p><p> </p> | + | <p> </p><p> </p><p> </p><p> </p><p> </p><p> </p><p> </p><p> </p><p> </p><p> </p><p> </p><p> </p><p> </p><p> </p><p> </p><p> </p><p> </p><p> </p> |
| + | <p> </p> | ||
| + | |||
| - | + | <font size=3>'''Result ~ <i>E. coli</i> in the touch display ~'''</font> | |
<html> | <html> | ||
| Line 225: | Line 228: | ||
</html> | </html> | ||
| - | == <font size=5>'''4 Low pressure-inducible promoter'''</font> == | + | == <font size=5>'''4. Low pressure-inducible promoter'''</font> == |
[[Image:tokyotech2008Previous study - Pressure response of Plac.png|thumb|right|350px|box|Figure 4-1. - Pressure response of Plac]] | [[Image:tokyotech2008Previous study - Pressure response of Plac.png|thumb|right|350px|box|Figure 4-1. - Pressure response of Plac]] | ||
<html> | <html> | ||
| Line 258: | Line 261: | ||
| - | = | + | <font size=3>'''Methods''' </font> |
<gallery widths="400px" heights="230px" > | <gallery widths="400px" heights="230px" > | ||
Image:Tokyotech2008PCR random mutagenesis.png|Figure 4-2 - PCR random mutagenesis | Image:Tokyotech2008PCR random mutagenesis.png|Figure 4-2 - PCR random mutagenesis | ||
| Line 273: | Line 276: | ||
*'''Step 3''' - A final passage. We sorted bacteria under pressure with repressor protein. Fluorescent bacteria are sorted. False negatives are removed. Therefore bacteria bearing promoter that are low pressure-inducible are isolated. | *'''Step 3''' - A final passage. We sorted bacteria under pressure with repressor protein. Fluorescent bacteria are sorted. False negatives are removed. Therefore bacteria bearing promoter that are low pressure-inducible are isolated. | ||
| - | = | + | |
| + | <font size=3>'''Results - Sequence and Characterization -''' </font> | ||
We finished step 1. | We finished step 1. | ||
Fluorescent and non-fluorescent bacteria were sorted and we characterized their promoter. | Fluorescent and non-fluorescent bacteria were sorted and we characterized their promoter. | ||
<gallery widths="430px" heights="240px" > | <gallery widths="430px" heights="240px" > | ||
| - | Image:Tokyotech2008Dot plot of cell sorting .png| | + | Image:Tokyotech2008Dot plot of cell sorting .png|figure 4-4. Dot plot of cell sorting |
| - | Image:Tokyotech2008Results of sequencing .png| | + | Image:Tokyotech2008Results of sequencing .png|figure 4-5. Results of sequencing |
</gallery> | </gallery> | ||
We sorted fluorescent (A) and non-fluorescent bacteria (B) with a flow cytometer. | We sorted fluorescent (A) and non-fluorescent bacteria (B) with a flow cytometer. | ||
| Line 287: | Line 291: | ||
Therefore, fluorescent bacteria have no mutation in CAP binding site, -35 or -10. | Therefore, fluorescent bacteria have no mutation in CAP binding site, -35 or -10. | ||
| - | + | We have successfully demonstrated that it is possible to collect promoters desired functions by PCR random mutagenesis and screening with a flow cytometry. | |
| - | We have successfully demonstrated that it is possible to collect | + | This results indicate that we can screen low pressure-inducible lac promoter mutant with this methods. |
| - | + | ||
| - | == <font size=5>'''5 Write/Erase cycle'''</font> == | + | == <font size=5>'''5. Write/Erase cycle'''</font> == |
| - | [[Image:Write-Erase_cycle.png|thumb|400px|right| | + | [[Image:Write-Erase_cycle.png|thumb|400px|right|figure 5-1. Write/Erase cycle]] |
While we can implement write-function, we want to implement additionally erase-function and memory-function. Erase-function enables us to erase the painted picture, and memory-function enables us to keep the picture after we stop induction. We call these functions "Write/Erase cycle". | While we can implement write-function, we want to implement additionally erase-function and memory-function. Erase-function enables us to erase the painted picture, and memory-function enables us to keep the picture after we stop induction. We call these functions "Write/Erase cycle". | ||
| Line 302: | Line 305: | ||
# '''Write-function''' | # '''Write-function''' | ||
| - | ## | + | ## '''P<sub>lac</sub>''' is under 30 MPa pressure. |
## P<sub>lac</sub> expresses CI and GFP. | ## P<sub>lac</sub> expresses CI and GFP. | ||
## CI represses P<sub>L</sub> and decreases LacI expression. | ## CI represses P<sub>L</sub> and decreases LacI expression. | ||
| Line 315: | Line 318: | ||
=== Mathematical model === | === Mathematical model === | ||
| - | |||
| - | |||
| - | |||
| - | |||
| - | |||
| - | |||
| - | |||
| - | |||
| - | |||
| - | |||
| - | |||
| - | |||
| - | |||
| - | |||
==== Why did we use mathematical model? ==== | ==== Why did we use mathematical model? ==== | ||
[[Image:Conditions_for_Write-function.png|thumb|500px|right| figure 5-3. Left If P<sub>L</sub> is not activated or is a bit, write-function is available. Right If P<sub>L</sub> is activated too much, write-function is not available]] | [[Image:Conditions_for_Write-function.png|thumb|500px|right| figure 5-3. Left If P<sub>L</sub> is not activated or is a bit, write-function is available. Right If P<sub>L</sub> is activated too much, write-function is not available]] | ||
| - | As mentioned above, it is known that P<sub>lac</sub> is activated '''94 | + | As mentioned above, it is known that P<sub>lac</sub> is activated '''94'''-fold under 30 MPa while we didn't know the increase of P<sub>L</sub> strength under 30 MPa. If P<sub>L</sub> is activated too much and P<sub>lac</sub> activity is weaker than P<sub>L</sub> activity, we can't implement write-function. So, how much is the range of the increase of P<sub>L</sub> activity under 30 MPa so as to become advantageous to that of P<sub>lac</sub>? To know this range, we need to use mathematical model. |
| Line 340: | Line 329: | ||
<gallery widths = "300px" heights="215px" perrow = "1" align = "right"> | <gallery widths = "300px" heights="215px" perrow = "1" align = "right"> | ||
| - | Image:Classical_toggle_switch_model.png| figure | + | Image:Classical_toggle_switch_model.png| figure 5-4. Classical toggle switch model |
Image:Transfer_Function.png| figure 5-5. Transfer function of P<sub>lac</sub> | Image:Transfer_Function.png| figure 5-5. Transfer function of P<sub>lac</sub> | ||
</gallery> | </gallery> | ||
| - | Our mathematical model under | + | Our mathematical model under 0.1 MPa is equal to a classical toggle switch model shown in figure 5-4. n<sub>CI</sub> is the cooperativity of repression of |
the lambda promoter, n<sub>LacI</sub> is the cooperativity of repression of the lac promoter, α<sub>PL</sub> is the effective rate of LacI synthesis | the lambda promoter, n<sub>LacI</sub> is the cooperativity of repression of the lac promoter, α<sub>PL</sub> is the effective rate of LacI synthesis | ||
and α<sub>Plac</sub> is the effective rate of CI synthesis. | and α<sub>Plac</sub> is the effective rate of CI synthesis. | ||
| Line 383: | Line 372: | ||
[[Image:PL_pressure_response.png|200px|none|thumb|left|figure 5-8. Pressure-response ability of P<sub>L</sub>]] | [[Image:PL_pressure_response.png|200px|none|thumb|left|figure 5-8. Pressure-response ability of P<sub>L</sub>]] | ||
We identified '''β<sub>(30)PL</sub> = 1.4''' by our wet experiment under 30MPa pressure (figure 5-6). Therefore, we can implement Write/Erase cycle if we choose an appropriate P<sub>L</sub> - RBS strength. | We identified '''β<sub>(30)PL</sub> = 1.4''' by our wet experiment under 30MPa pressure (figure 5-6). Therefore, we can implement Write/Erase cycle if we choose an appropriate P<sub>L</sub> - RBS strength. | ||
| - | |||
| - | |||
| - | |||
| - | |||
| - | |||
| - | |||
| - | |||
| - | |||
| - | |||
Latest revision as of 05:25, 30 October 2008
| Main | Protcol | Parts Submitted to the Registry | Our Team | Acknowledgements |
|---|
Contents |
1. Our project
|
Our project is creation of "Coli Touch"!!
|

|

|
What is "Coli touch"?
“Coli Touch” has a pressure sensitive display composed of an E. coli lawn. When you touch its display, touched section is colored.
Next I'll tell you about “Coli Touch” work system. Display of “Coli Touch” contains many E. coli. When you touch this display, pressure applies to E. coli in this display. Pressure applied E. coli expresses GFP.
Why pressure?
“Coli Touch” uses pressure as input. Why do we use pressure? Past input methods (small molecules, heat and light) are difficult to induce uniformly.
Pressure can induce uniformly.
|
2. Pressure induction
Introduction
|
Tet promoters is known as a sensitive ones to pressure. (T. Sato et al., 1995) |
Construction
Result -activity of tet promoters-
|
The result shows that the tet promoter activity under 30 MPa, without repressor protein, is about 3-fold stronger than the tet promoter activity under 0.1 MPa. Therefore, we confirmed that the tet promoter was induced under 30 MPa. |
3. Touch display
Touch display (plan)
|
Touch display which we planned has many holes, and E. coli is in these holes.(figure 3-1 a) As the first step of creating the touch display, we created Prototype touch display. figure 3-1 b)
|
Prototype touch display
|
We created a Prototype touch display made of acrylic glasses. This touch display has two kinds of holes(show figure 3-2). Each hole contains culture medium and E. coli is cultivated in these holes. One hole (A) can be pressurized, because the hole is covered with only a plastic tape. Water pressure conducts into the hole.
The other (B) is not pressurized, because the hole is covered with a block made of acrylic glasses. Water pressure doesn’t conduct into the hole.
|
Result ~ E. coli in the touch display ~
|
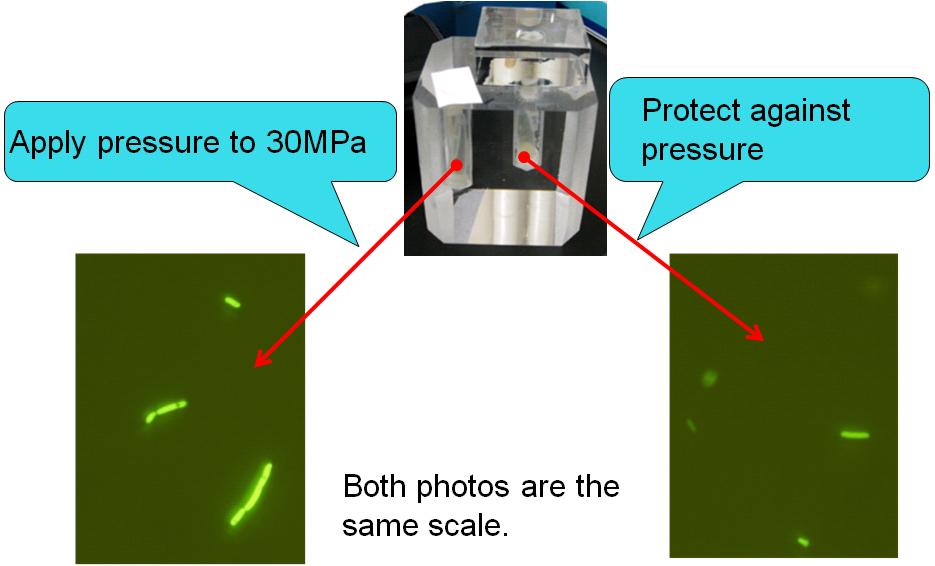
After incubation, we observed the E. coli by a fluorescence microscope. |
|
The touch display successfully regulated GFP expression in E. coli ! |
4. Low pressure-inducible promoter
Methods
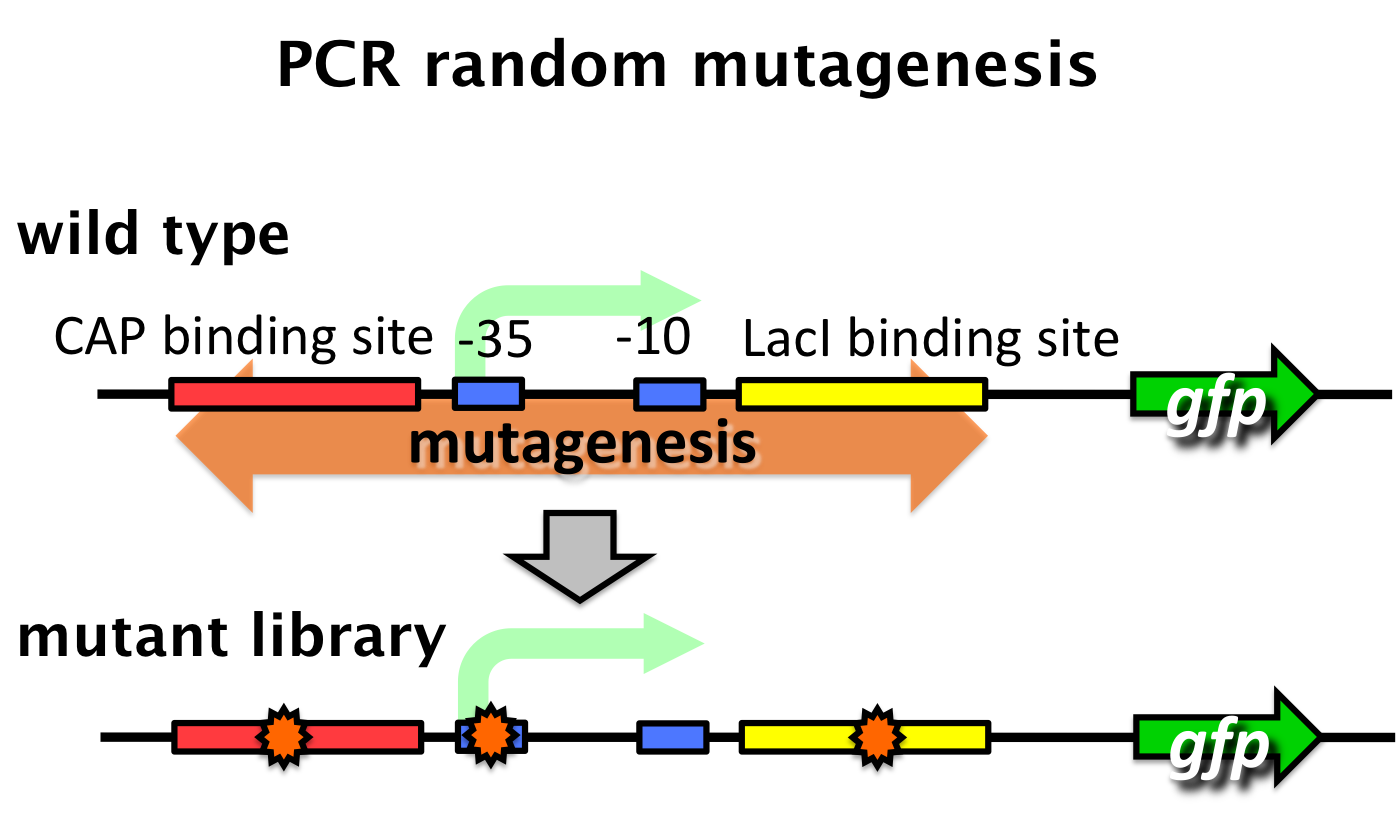
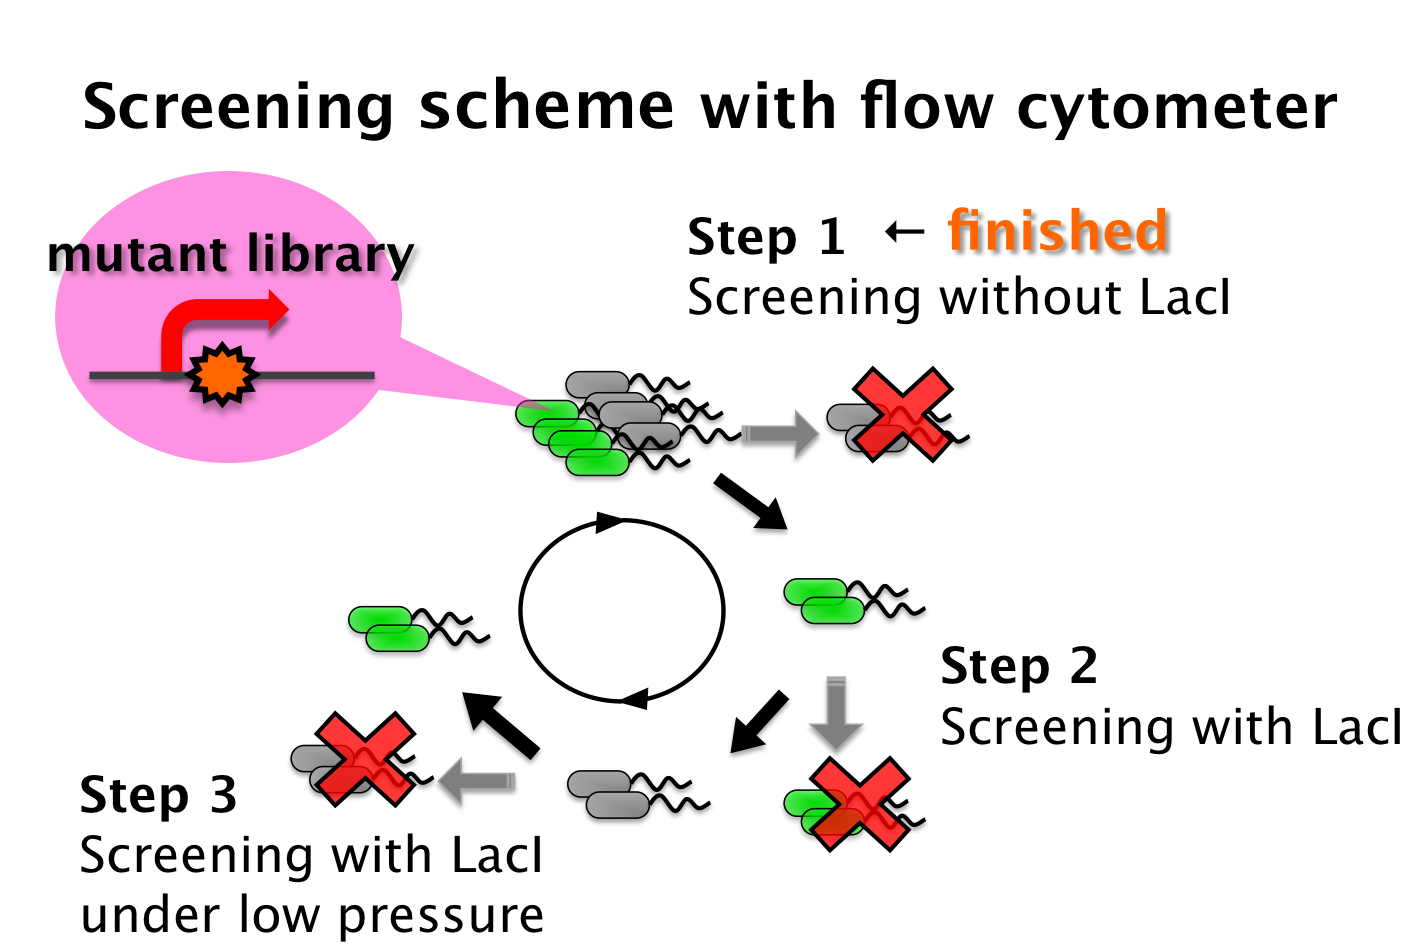
We tried to develop a low pressure inducible promoter by PCR random mutagenesis to lac promoter. Then we screened an E. coli library, with flow cytometry, for promoters that are induced under low pressure. This scheme is based on the ability to separate bacteria, with a flow cytometer, in response to expression, or lack of expression, of a fluorescent marker.
- Step 1 - Fluorescent bacteria without repressor protein were collected by a flow cytometer. This sorted pool contains bacteria bearing both constitutive and low pressure-inducible promoter.
- Step 2 - This sorted pool contains bacteria bearing both constitutive and pressure-inducible promoter fusions. False positives are removed with repressor protein. All non-fluorescent bacteria are sorted.
- Step 3 - A final passage. We sorted bacteria under pressure with repressor protein. Fluorescent bacteria are sorted. False negatives are removed. Therefore bacteria bearing promoter that are low pressure-inducible are isolated.
Results - Sequence and Characterization -
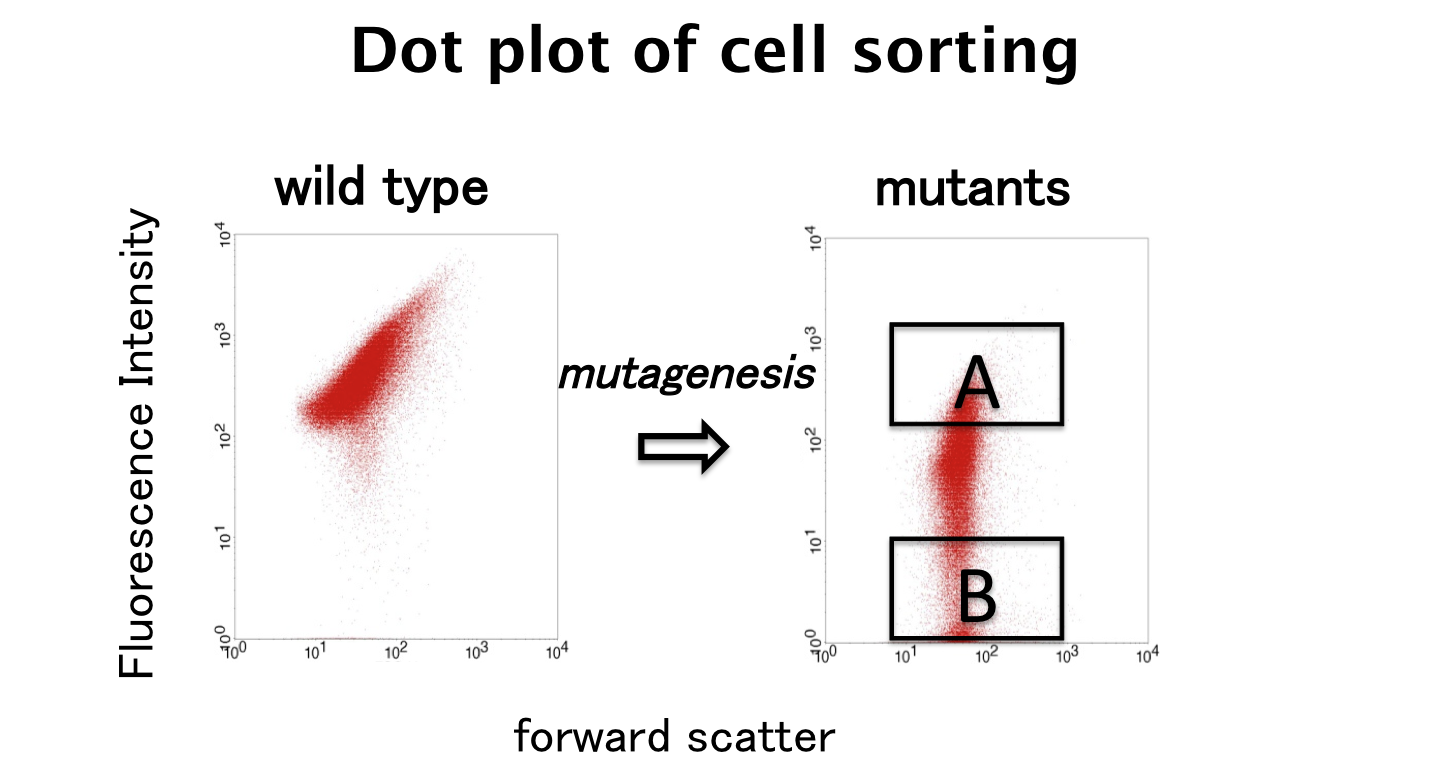
We finished step 1.
Fluorescent and non-fluorescent bacteria were sorted and we characterized their promoter.
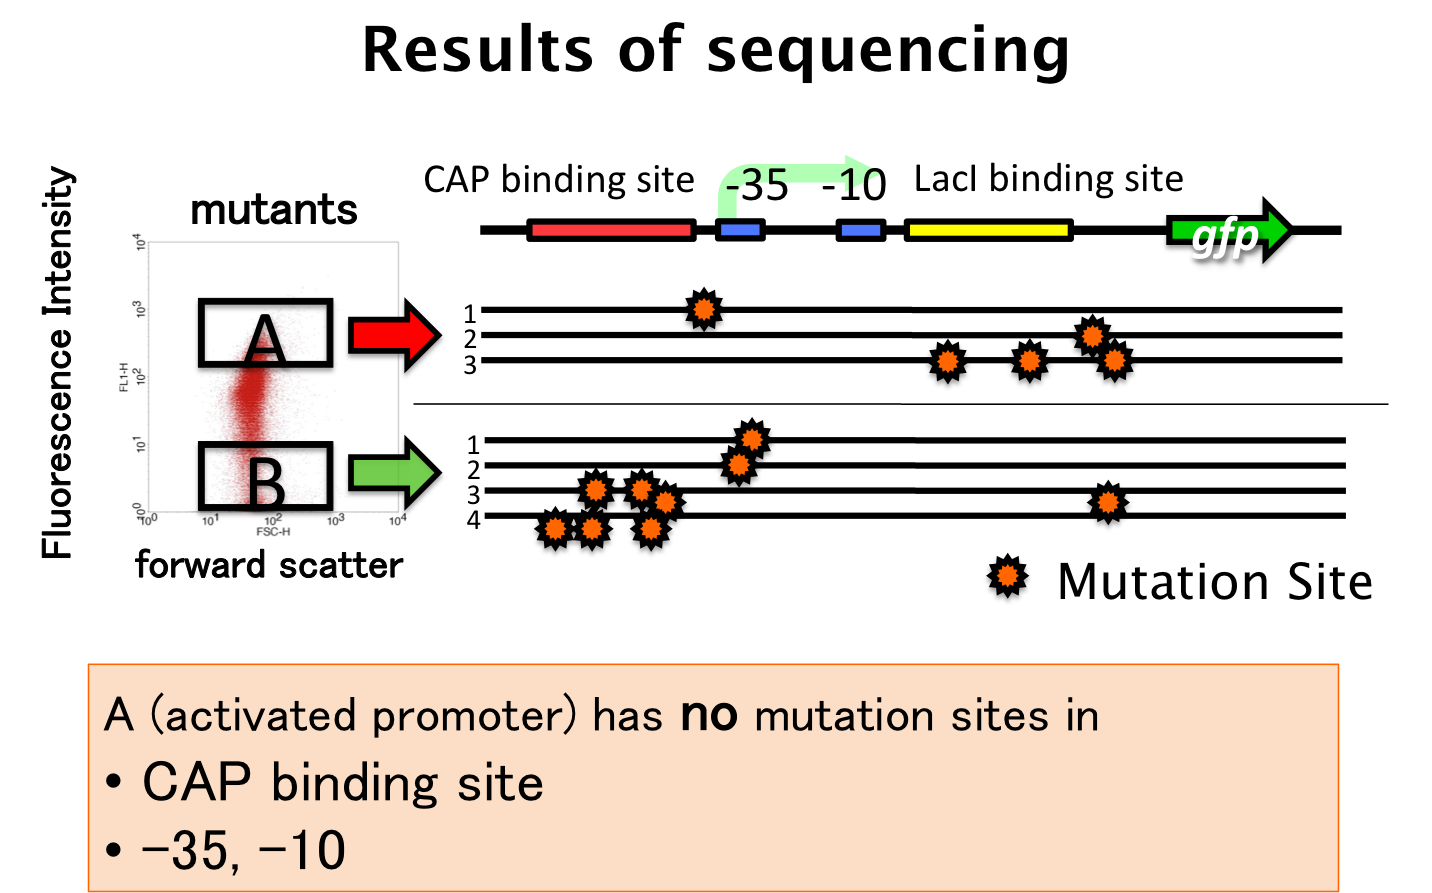
We sorted fluorescent (A) and non-fluorescent bacteria (B) with a flow cytometer. Then, we analyze these base sequences.
- A have mutations in LacI binding site or non-functional DNA.
- B have mutations in CAP binding site, -35 or non-functional DNA.
Therefore, fluorescent bacteria have no mutation in CAP binding site, -35 or -10.
We have successfully demonstrated that it is possible to collect promoters desired functions by PCR random mutagenesis and screening with a flow cytometry. This results indicate that we can screen low pressure-inducible lac promoter mutant with this methods.
5. Write/Erase cycle
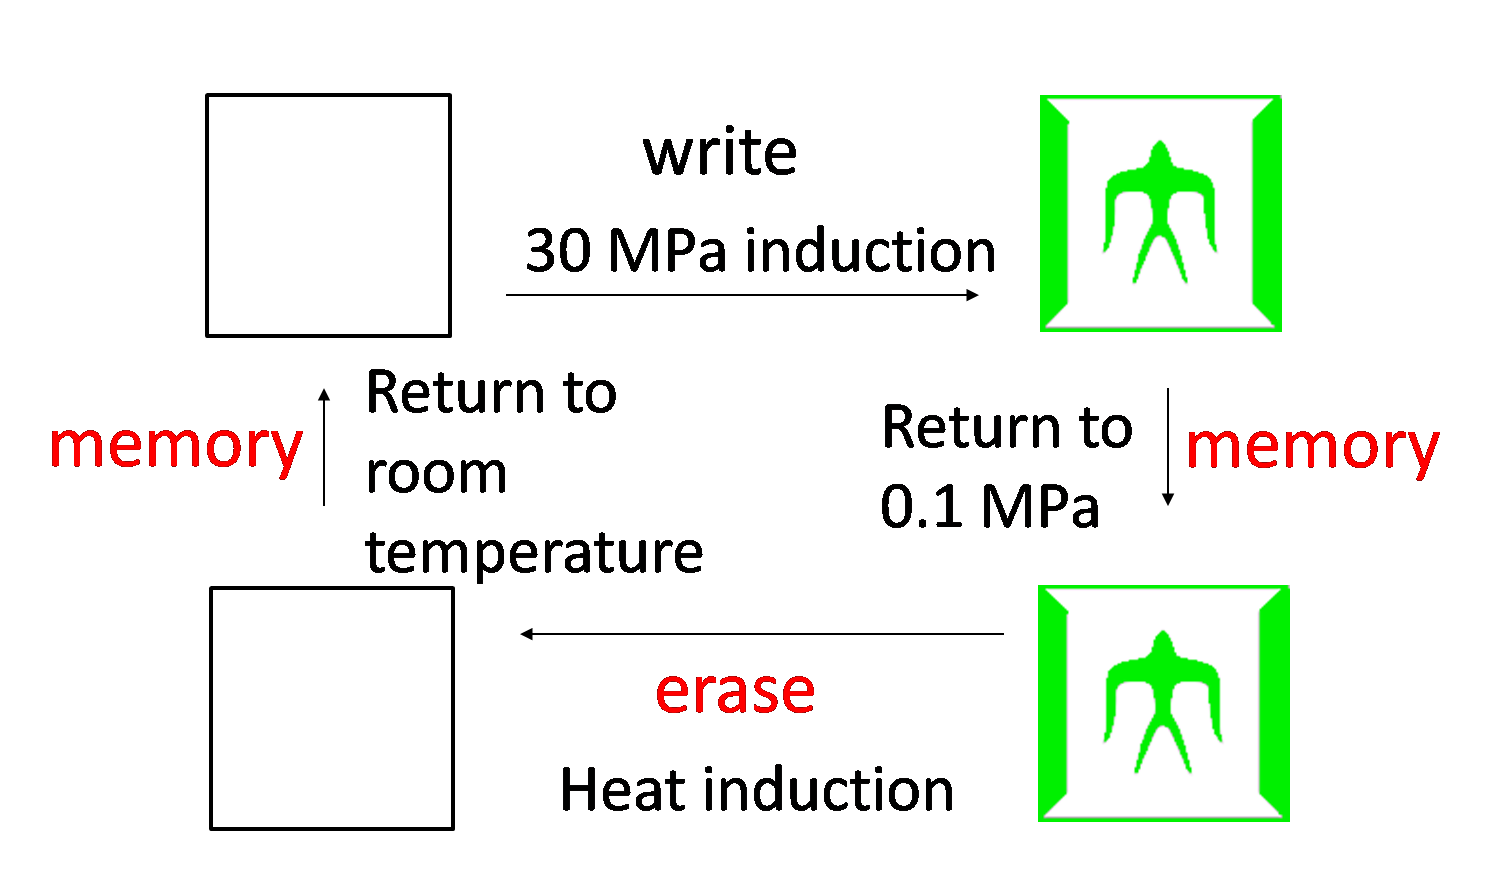
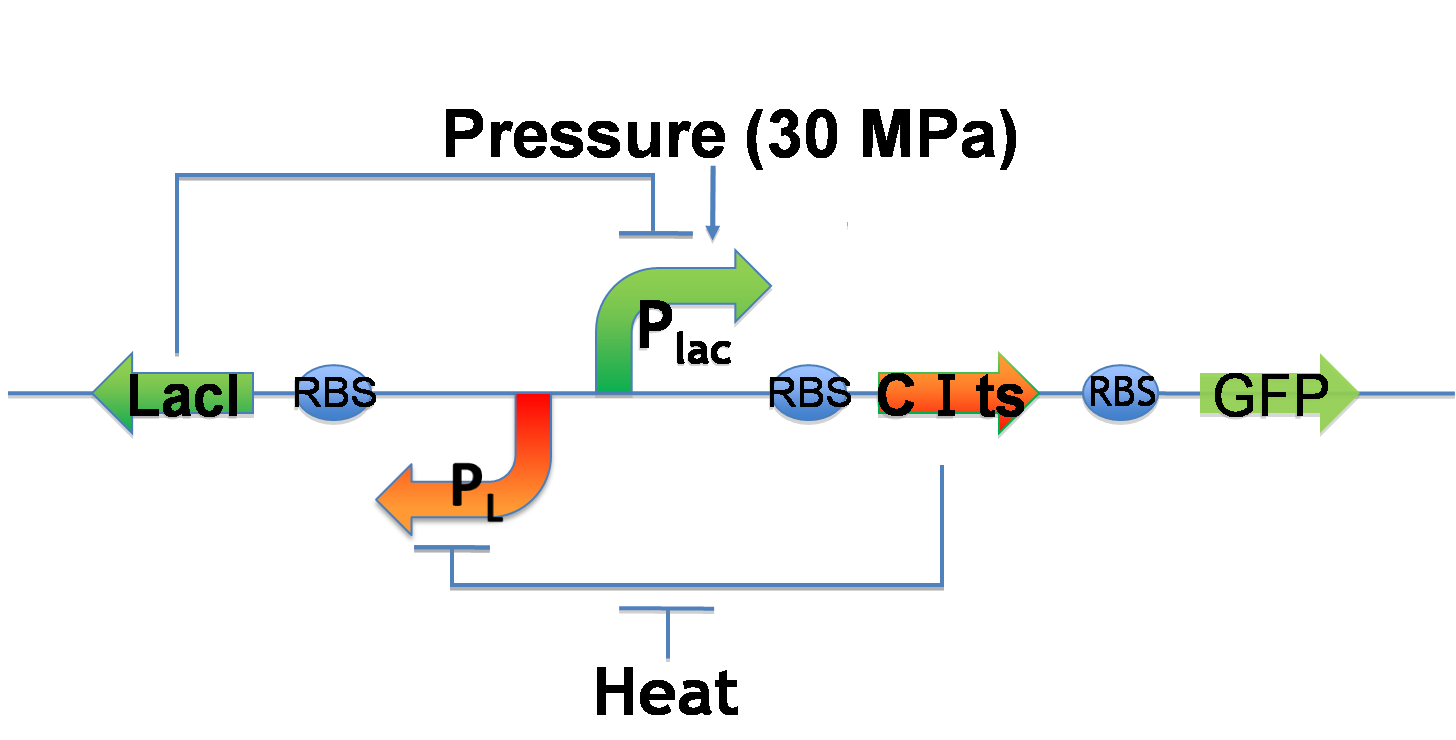
While we can implement write-function, we want to implement additionally erase-function and memory-function. Erase-function enables us to erase the painted picture, and memory-function enables us to keep the picture after we stop induction. We call these functions "Write/Erase cycle". In order to implement Write/Erase cycle, we tried to construct genetic toggle switch.
Genetic toggle switch to implement Write/Erase cycle
- Write-function
- Plac is under 30 MPa pressure.
- Plac expresses CI and GFP.
- CI represses PL and decreases LacI expression.
- Low LacI expression increases Plac activity. ⇒ Bright!!
- Erase-function
- The heat activates PL.
- PL expresses LacI.
- LacI represses Plac.
- Therefore, GFP expression decreases.
Mathematical model
Why did we use mathematical model?
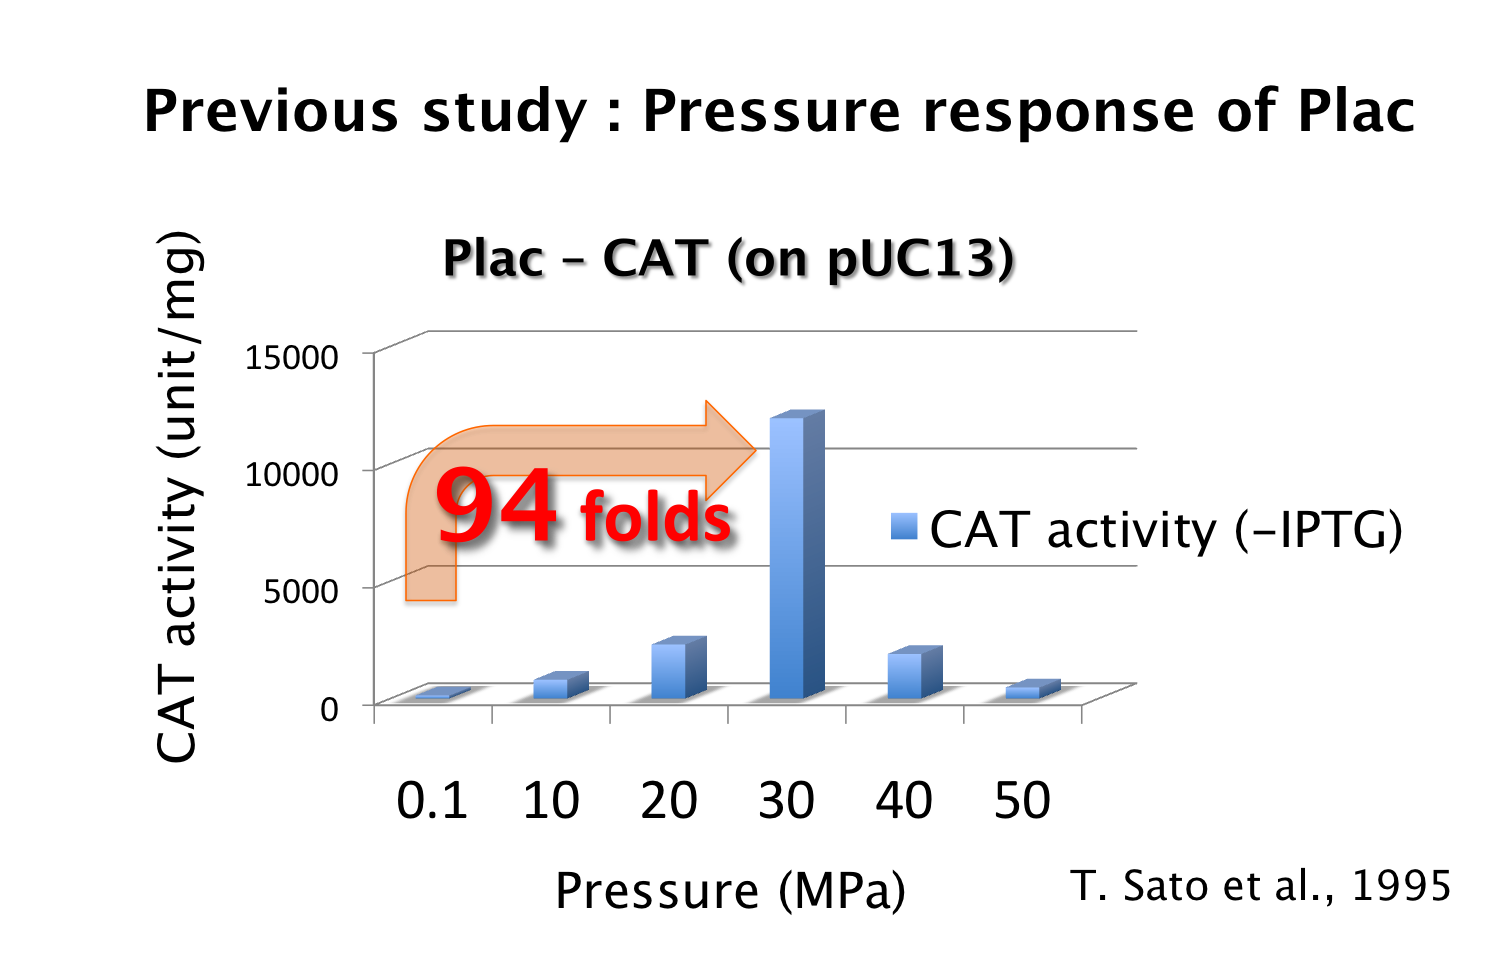
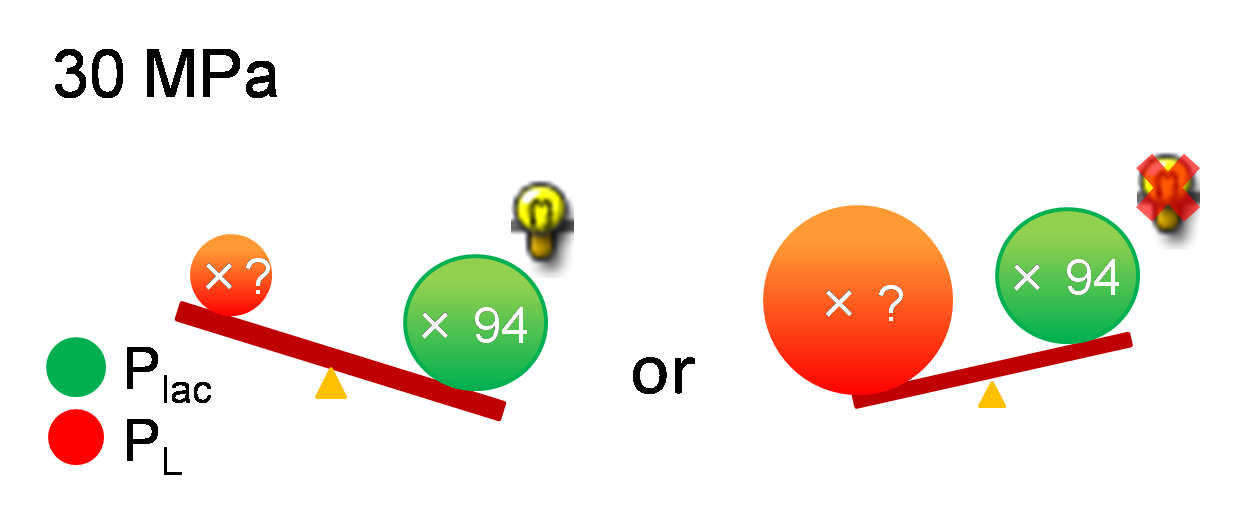
As mentioned above, it is known that Plac is activated 94-fold under 30 MPa while we didn't know the increase of PL strength under 30 MPa. If PL is activated too much and Plac activity is weaker than PL activity, we can't implement write-function. So, how much is the range of the increase of PL activity under 30 MPa so as to become advantageous to that of Plac? To know this range, we need to use mathematical model.
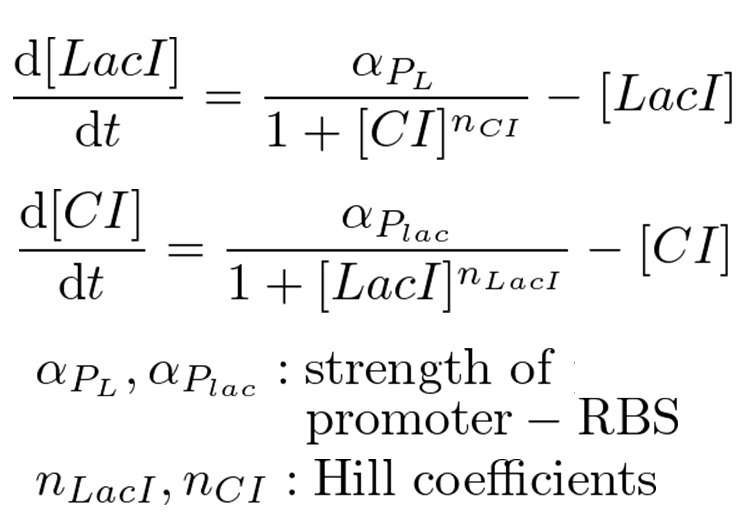
Classical toggle switch model
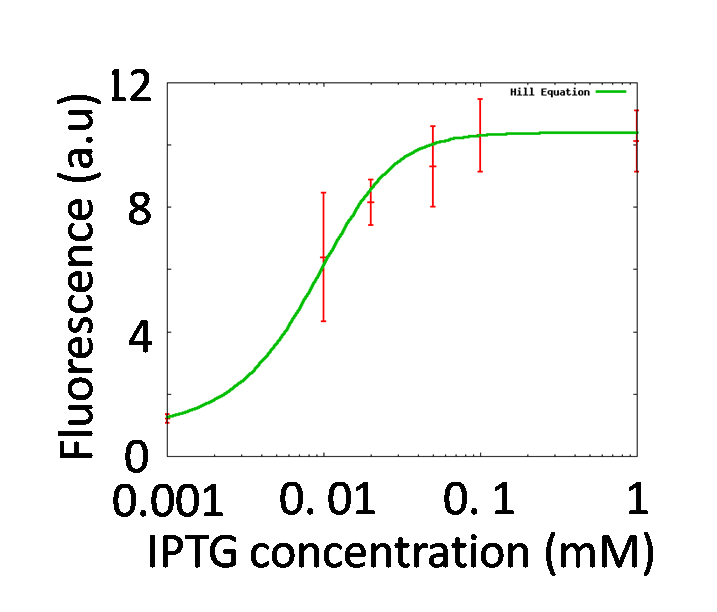
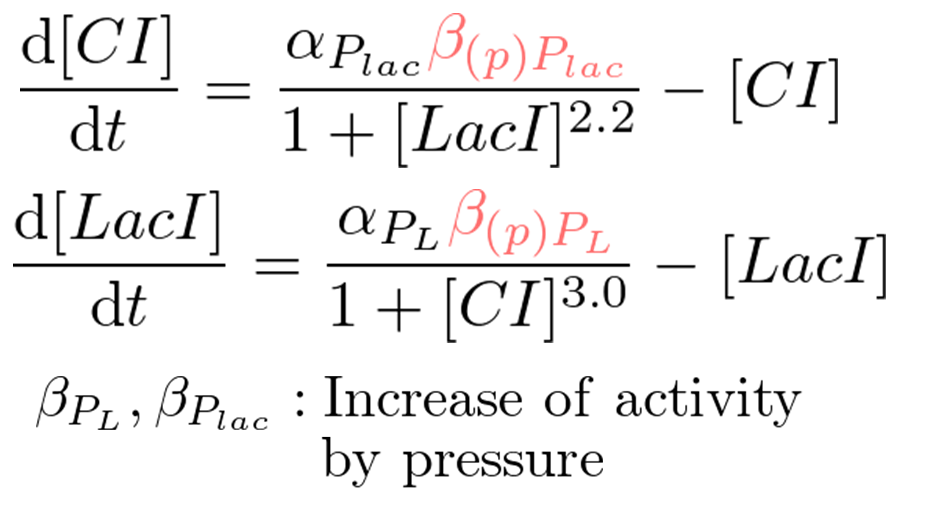
Our mathematical model under 0.1 MPa is equal to a classical toggle switch model shown in figure 5-4. nCI is the cooperativity of repression of the lambda promoter, nLacI is the cooperativity of repression of the lac promoter, αPL is the effective rate of LacI synthesis and αPlac is the effective rate of CI synthesis. nCI and nLacI are called "Hill coefficient". αPL and αPlac depend on strength of promoter-RBS, and are adjustable. Identifying value of nCI and nLacI are required for the modeling. But we know nCI = 3.0 (T. Tian et al., 2006). So, we measured fluorescence intensity various IPTG concentration to identify nLacI.
Identification of nLacI
By testing how LacI represses the lac promoter, Hill coefficient of lac promoter should be decided. In order to adjust effective concentration of LacI, IPTG was added.
GFP fluorescence intensity was enhanced in an IPTG-dose dependent manner. It indicates that the LacI repression was getting weaker by adding IPTG. The characteristics of the lac promoter were calculated by fitting Hill function to the plots shown in figure 5-5, Finally, we obtained nLacI = 2.2.
Conditions for bistability
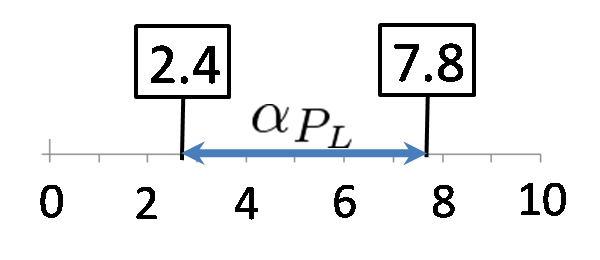
We calculated the range of αPL in which a toggle switch model is bistability. Here, we set αPlac = 3.0. The result is below.
Pressure model
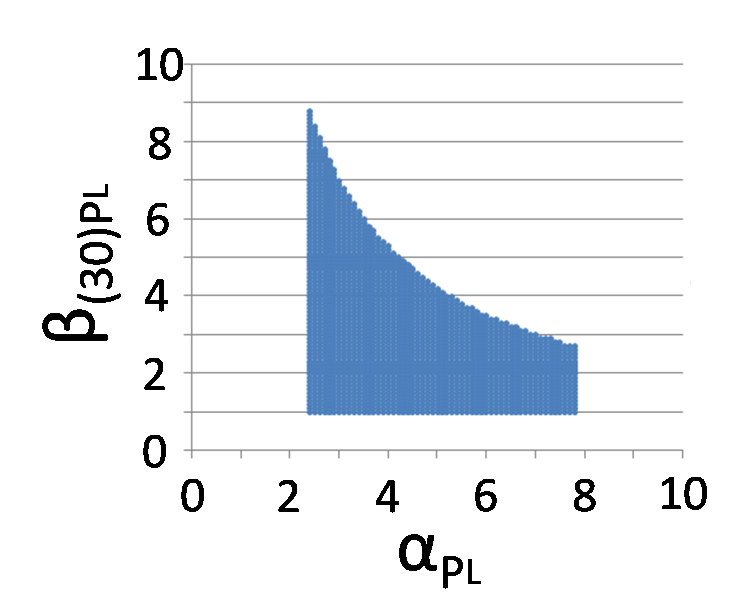
We proposed pressure-inducible genetic toggle switch model which has additional parameters to the classic toggle switch model. These parameters show the increase of activity by pressure (β(p)Plac or β(p)PL). Under atmospheric pressure (0.1 MPa), β(0.1)Plac = 1.0 and β(0.1)PL = 1.0. On the other hand, under 30 MPa, β(30)Plac = 94 and β(30)PL was not known.
In order to implement write-function, the transit of the system from bistability to monostable (Plac is stronger than PL) by 30 MPa pressure is required. Therefore, we calculated the range of β(30)PL which satisfies the above conditions.
The feasibility of implementation of Write/Erase cycle
According to the result of simulation, we found that we can implement Write/Erase function even if PL is activated 2.5-fold when αPL = 7.8.
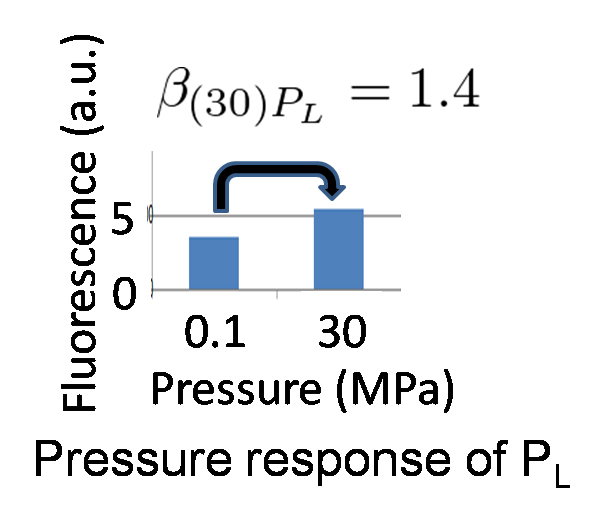
We identified β(30)PL = 1.4 by our wet experiment under 30MPa pressure (figure 5-6). Therefore, we can implement Write/Erase cycle if we choose an appropriate PL - RBS strength.
 "
"
