Team:NTU-Singapore/Wetlab/Experimental Results
From 2008.igem.org
|
Contents |
Testing our Lysis system
As stated before, we wish to verify that the cells with the pLsrA-Lysis system would lyse upon Ai-2 inoculation. We used the OD of the cells as a form of verification in this experiment.
OD600 measurement of pLsrA-Lysis-containing LuxS mutant upon addition of AI-2
Initial Phase
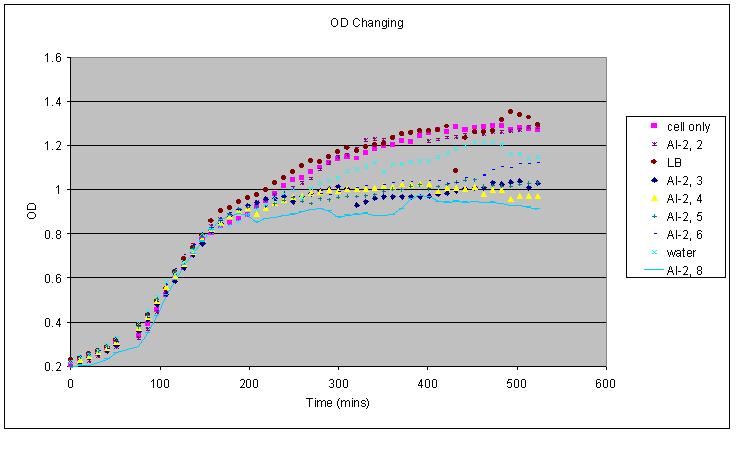
The following picture shows when AI-2 solution is added at initial time
Note that, cell only means there is only 200 µL cell in the well, AI-2, 2 means the AI-2 solution is collected at 2hrs. The results shows that with LB or water the cell culture reach higher steady state comparing to that with AI-2 solution as we can see the divergence at around 4hrs. all AI-2 solution (AI-2 3, 4, 5, 6, 8) except AI-2, 2 shows depressed steady state, indicating that, AI-2 is actually working
After 1 hr
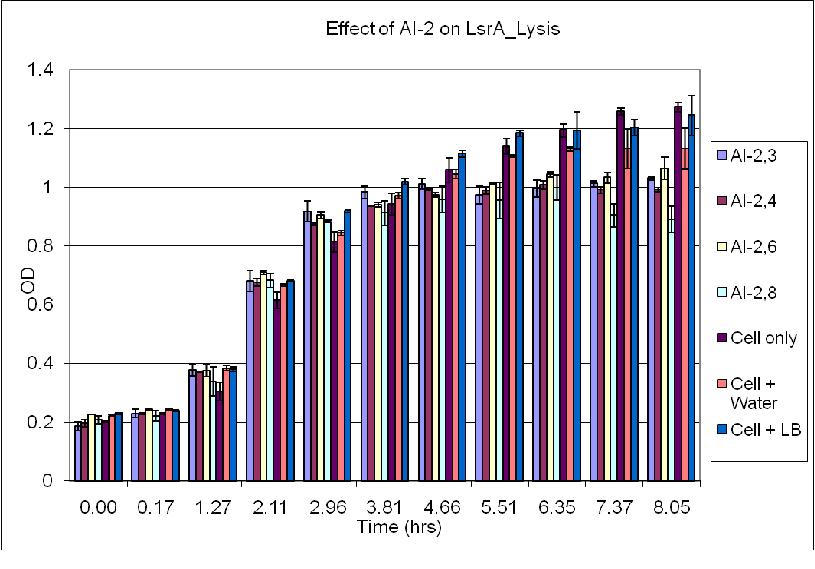
The following picture shows when AI-2 solution is added at 1hr later
This also shows the expected result, with AI-2 present, the cell culture shows a lower steady state.
This error bar graph shows OD600 of each sample at different time intervals together with the standard deviation. It is clear from the graph that the variance of data is much smaller than the absolute value. Hence, the data obtained from the absorbance-meter is highly reliable. "
"


