Team:NTU-Singapore/Modelling/Parameter/LysisaF
From 2008.igem.org
Revision as of 15:10, 28 October 2008 by Lalala8585 (Talk | contribs)
|
Parameter aF analysis
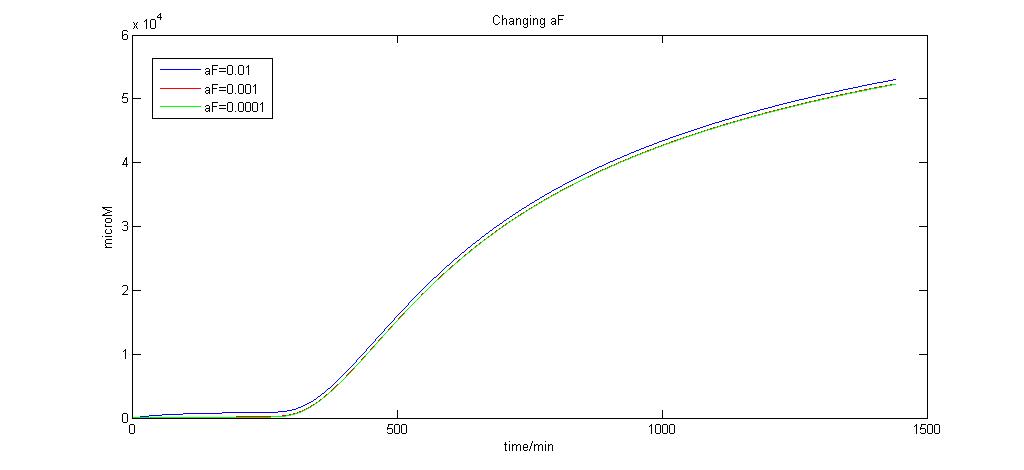
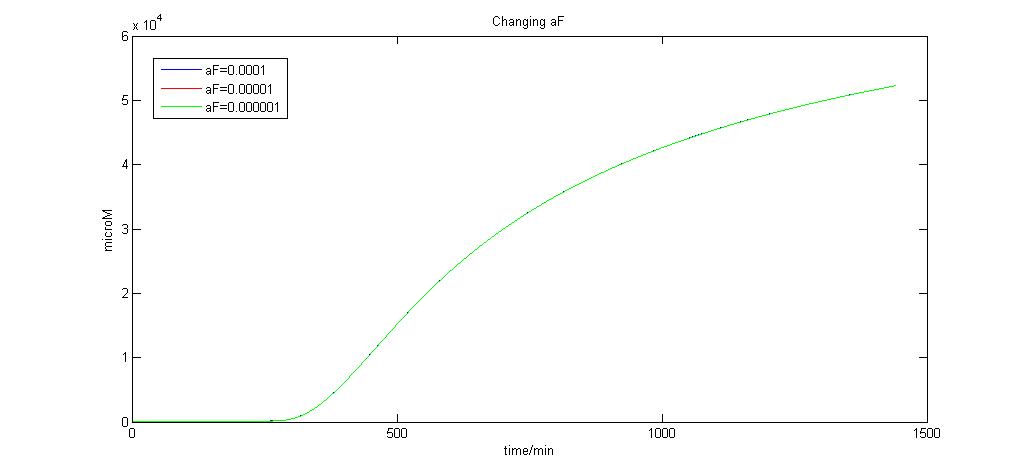
Here we attempt to change aF over a range of values to observe how aF affects the production of the lysis protein.
Graph of aF (0.01, 0.001, and 0.0001)

Graph of aF (0.0001,0.00001 and 0.000001)

As we can see, when aF = 0.0001, any more reduction in its value by the order of 10 produces no significant change. We choose aF to be 0.0001 for this reason since it is the limiting value.
 "
"

