Chemotaxis Modeling
From 2008.igem.org
(→Tables and Charts) |
(→Equations and Parameters) |
||
| Line 14: | Line 14: | ||
== Equations and Parameters == | == Equations and Parameters == | ||
| + | '''Software Platform''' | ||
| + | |||
| + | We build a software plat for simulating bacteria movement on plat in the first step of our modeling works. This platform enables investigators to simulate bacterium movement, track their trace and analyze chemotaxis effects, facilitating pathway design and test. Our researches about each subprojects in Project 1 are based on these tools. | ||
| + | |||
| + | Our software platform is made up by three main modules: concentration field, motor and pathway. | ||
| + | |||
| + | Concentration field module: the concentration of target chemical in each location. The shape of the field can be set in each simulation in order to fit our need. In most of our experiments, we use mountain-shaped field (L=L_0*exp(-(x/r)^2)). | ||
| + | |||
| + | Motor module: A Markov chain with state 0 (tumble) and 1 (run) to represent the working state of molecular motor impelling E. coli. The state of molecular motor is approximated to not change in a small time scale. The state in the next time scale is determined by current state and CheY-p concentration. | ||
| + | |||
| + | Pathway module: A set of differential equation expressing the dynamic relationship between ligand and CheY-p concentration. Users can simulate an entirely new chemotaxis pathway by merely modify this module. This helps researchers focus on pathway design without considering other parts of the model. | ||
| + | |||
| + | The program we used simulates the movement of bacteria on plate, so the position of E. coli is described by a 2 dimensional vector. In each simulation, all the bacteria start the same initiation position but their directions are randomly selected. The concentrations of molecule in the pathway are set at equilibrium. At the end of each times scale, the concentration of CheY-p is calculated and this value influences motor state in the next time scale. | ||
| + | |||
| + | |||
| + | ---- | ||
| + | |||
'''CdLocalizer''' | '''CdLocalizer''' | ||
Revision as of 03:17, 30 October 2008
| HOME | Team | Project 1 | Project 2 | Parts | Modelling | Notebook | Doodle Board |
|---|
Equations and Parameters
Software Platform
We build a software plat for simulating bacteria movement on plat in the first step of our modeling works. This platform enables investigators to simulate bacterium movement, track their trace and analyze chemotaxis effects, facilitating pathway design and test. Our researches about each subprojects in Project 1 are based on these tools.
Our software platform is made up by three main modules: concentration field, motor and pathway.
Concentration field module: the concentration of target chemical in each location. The shape of the field can be set in each simulation in order to fit our need. In most of our experiments, we use mountain-shaped field (L=L_0*exp(-(x/r)^2)).
Motor module: A Markov chain with state 0 (tumble) and 1 (run) to represent the working state of molecular motor impelling E. coli. The state of molecular motor is approximated to not change in a small time scale. The state in the next time scale is determined by current state and CheY-p concentration.
Pathway module: A set of differential equation expressing the dynamic relationship between ligand and CheY-p concentration. Users can simulate an entirely new chemotaxis pathway by merely modify this module. This helps researchers focus on pathway design without considering other parts of the model.
The program we used simulates the movement of bacteria on plate, so the position of E. coli is described by a 2 dimensional vector. In each simulation, all the bacteria start the same initiation position but their directions are randomly selected. The concentrations of molecule in the pathway are set at equilibrium. At the end of each times scale, the concentration of CheY-p is calculated and this value influences motor state in the next time scale.
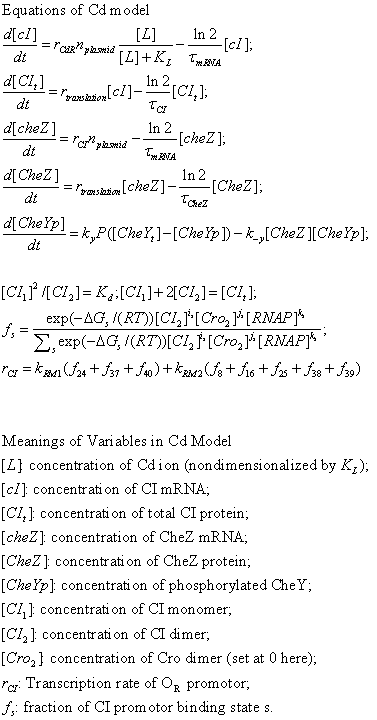
CdLocalizer
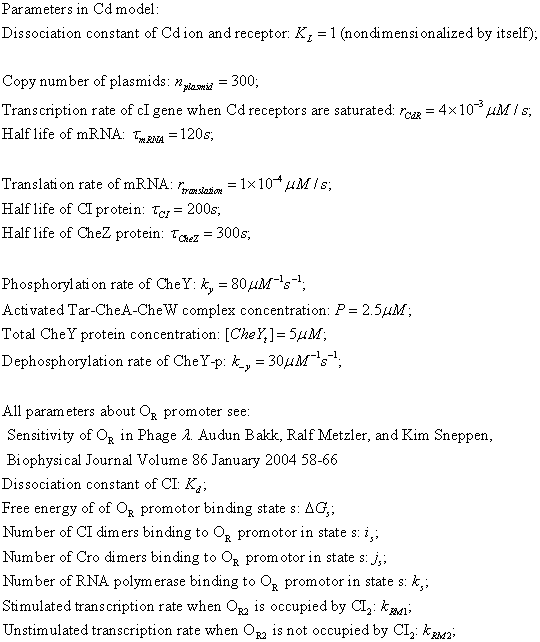
DualReceptor
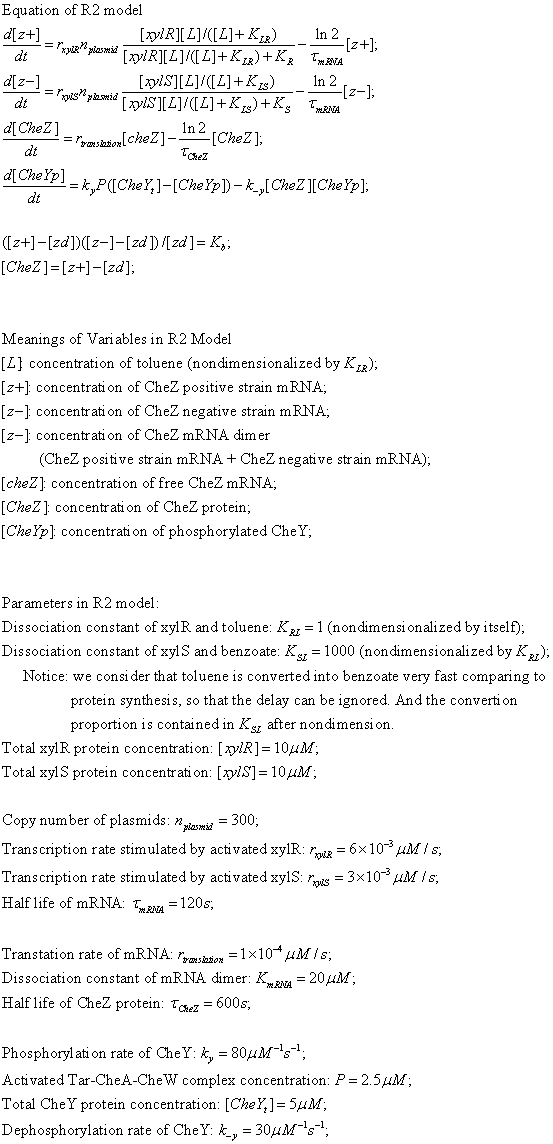
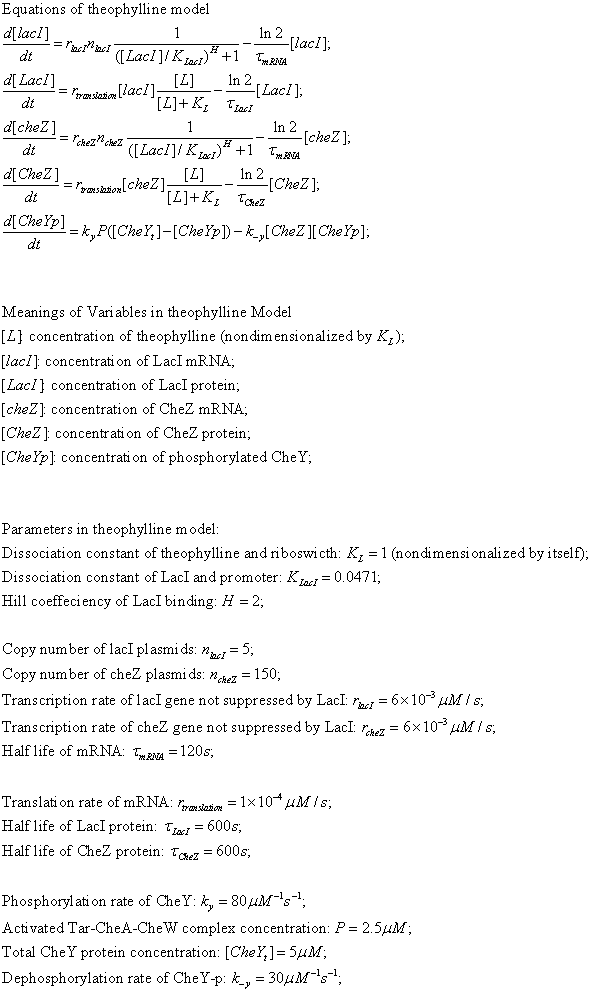
TheoRiboSwitch
Tables and Charts
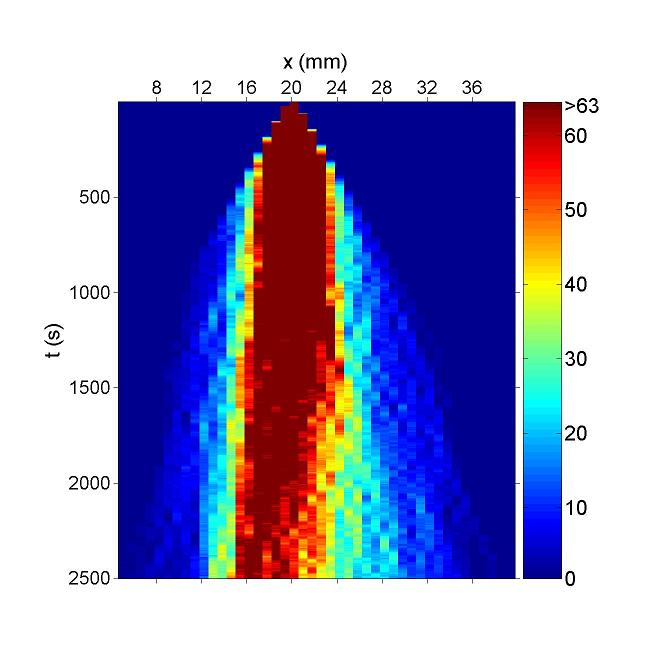
Figure. Simulation result of Bacteria movement of CdLocalizer Project. Chemotaxis behaviors of 1000 bacteria are simulated in a mountain-shaped concentration field. The peak value of the concentration field is 10 and size constant of it is 10 mm. Horizontal axis is x coordinate of bacteria while vertical axis is time. The change in color illustrates the density of bacteria.Deep Red is the most while blue is none.In this chart the bacteria moves toward a certain concentration of designated chemical.
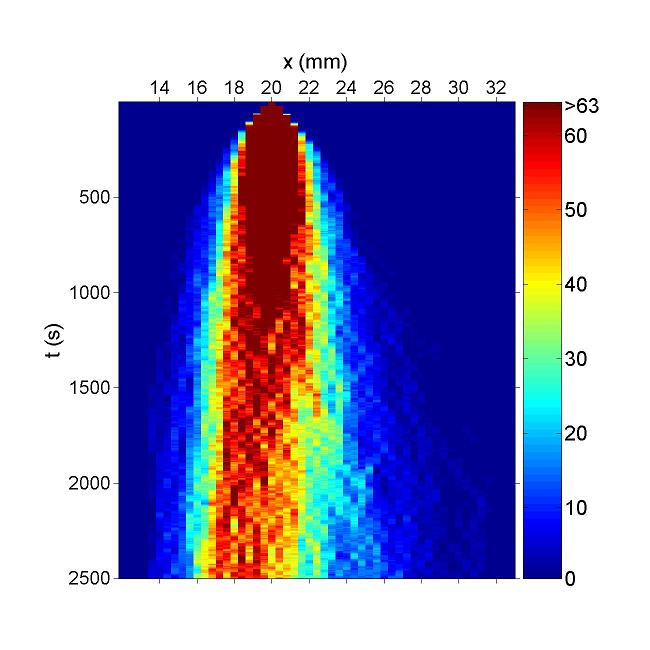
Figure. Simulation result of Bacteria movement of DualReceptor Project. Chemotaxis behaviors of 1000 bacteria are simulated in a mountain-shaped concentration field. The peak value of the concentration field is 20 and size constant of it is 14 mm. Horizontal axis is x coordinate of bacteria while vertical axis is time. The change in color illustrates the density of bacteria.Deep Red is the most while blue is none.In this chart the bacteria moves toward a certain concentration of designated chemical.
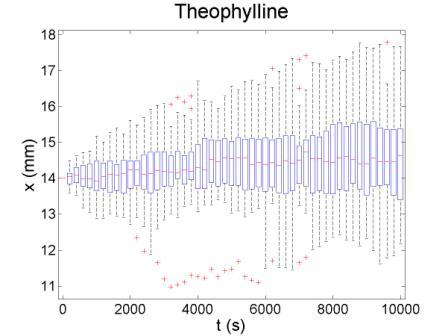
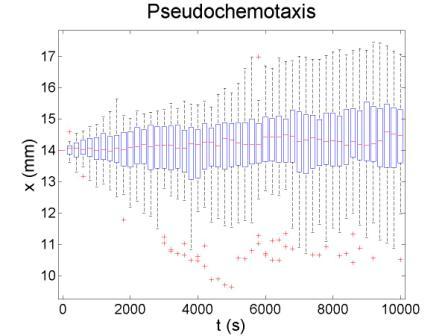
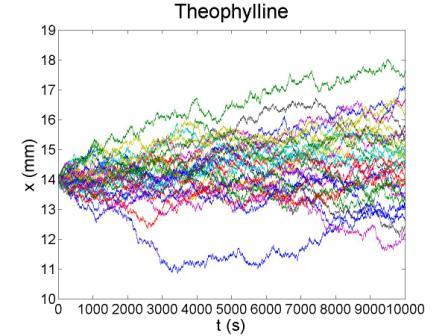
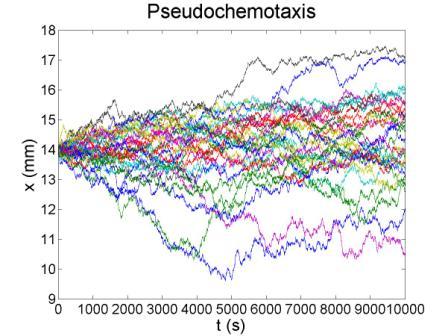
These figures show the x coordinate of 50 bacteria in a time sequence from 0s to 10000s. Bacterial chemotaxis behaviors are simulated in a mountain-shaped concentration field. The peak value of the concentration field is 2 and size constant of it is 20 mm. The chemotaxis effects of theophylline chemotaxis design and pseudochemotaxis are compared here. Pseudochemotaxis model derives from theophylline model via setting copy number of LacI plasmid at 0. Bacterium motilities of the two models are regulated to the same level to make them comparable. Top two figures are box plots which show the distribution of x coordinate. The box has lines at the lower quartile, median, and upper quartile x values of bacterium population. The whiskers extending from each end of the box show the extent of the rest of x coordinate value. Outliers marked by red plus are bacteria with x values beyond the ends of the whiskers. The contents of two figures at the bottom are similar to those above. They show the x-t curves of each bacterium.
These results illustrate that the chemotaxis effects is not improved significantly after adding a feed back loop to the pathway. Therefore, we should think about a question: what is the sufficient condition for a pathway to direct chemotaxis well. Some conditions learned from WT chemotaxis pathway are necessary, which means chemotaxis behavior will be harmed if they are not fulfilled.
Our following research focus on how to find a design principles of chemotaxis pathway. Actually, functions of chemotaxis pathway involve two aspects: signal transduction and signal conversion. It not only bring ligand concentration signal to molecule motor, but also calculates the signal in order to make motor work in right state. Cybernetics provides an idea that we should design the quantity relationship between input and output before considering pathway realization. We analyze dynamic properties of WT chemotaxis pathway and design linear controller according to that.
After finding a good controller, we start to design novel chemotaxis pathway basing on it. The design and chemotaxis effects are as following:


Check positive, negative and pseudochemotaxis design. Chemotaxis behaviors of 50 bacteria are simulated in a mountain-shaped concentration field. The peak value of the concentration field is 2 and size constant of it is 2 mm. Comparing to pseudochemotaxis, both of positive and negative chemotaxis pathway we designed effectively direct chemotaxis behaviors. How ever, the parameter in our design aquire a rapidthe pathway response, which can not be achieved by gene regulation on mRNA level. Thus we only draw a blueprint of this pathway:
| HOME | Team | Project 1 | Project 2 | Parts | Modelling | Notebook | Doodle Board |
|---|
 "
"

