Designed Charts
From 2008.igem.org
Revision as of 22:17, 29 October 2008 by Ylzouyilong (Talk | contribs)
| HOME | Team | Project 1 | Project 2 | Parts | Modelling | Notebook | Doodle Board |
|---|
Plasmids
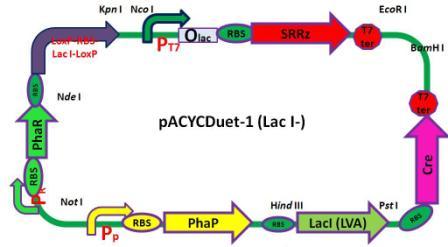
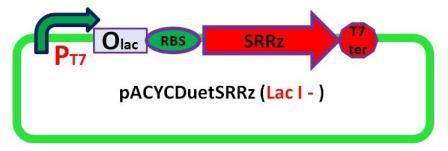
6 pACYC(LacI-)DuetSRRzPpPhaPLacILVACret7terPrPhaRLoxPLacILoxP 
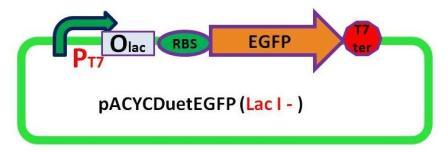
7 pACYC(LacI-)DuetEGFPPpPhaPLacILVACret7terPrPhaRLoxPLacILoxP 
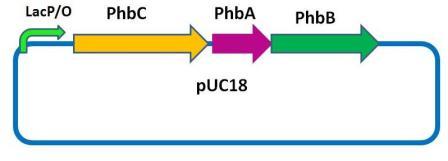
Notes: PhbCAB is enough for E.coli to synthesis and accummulate PHB granules. PhaP and PhaR proteins both can bind to PHB granules competitively while binding capability of PhaP is stronger than PhaR,but the promotor of PhaR is constitutively active while promotor of PhaP can be inhibited by PhaR protein. So there will be a peak of PhaP protein in the cell as size of PHB granule is increasing.(Illustrated in the simulation section.) The peak is also a change in PL repressor level, which will lead to a change in PL activity,i.e. lysis gene(Reporter gene) expression level.
| HOME | Team | Project 1 | Project 2 | Parts | Modelling | Notebook | Doodle Board |
|---|
 "
"


