 "
"
Here
From 2008.igem.org
(Difference between revisions)
| Line 86: | Line 86: | ||
<br> | <br> | ||
<img src="http://lh5.ggpht.com/coa07mhk/SQZQ0R3tEeI/AAAAAAAAAPA/N_x0O2WupfY/s800/G1.PNG" /> | <img src="http://lh5.ggpht.com/coa07mhk/SQZQ0R3tEeI/AAAAAAAAAPA/N_x0O2WupfY/s800/G1.PNG" /> | ||
| + | <br> | ||
| + | <br> | ||
| + | The red curve is nearly half times wider than the green curve. It follows that standard deviation of red curve is greater thus the probability of contact (CAI-1 with Fusion kinase) is nearly half as compared to the probability of rest of reaction. To understand this consider an example of biscuits. Red curve shows each a biscuit made is different to the other produced under same conditions whereas green curve shows that the probability of two biscuits to be same is high. | ||
<br>. | <br>. | ||
</td> | </td> | ||
Revision as of 23:15, 28 October 2008


|

|
|
Let us consider the probability of CAI-1 interacting with our fusion kinase with a reaction rate k, diffusion rates D1 and D2 and they start at a distance d apart at the beginning of the time interval  The reaction between two diffusing particles can be considered to take place in two steps. First the encounter of CAI-1 with Fusion kinase and second the actual reaction of passing protein to response regulatory receptor. If we let CAI-1 as entity A and fusion kinase as entity B then the rate of reaction can given as: The reaction between two diffusing particles can be considered to take place in two steps. First the encounter of CAI-1 with Fusion kinase and second the actual reaction of passing protein to response regulatory receptor. If we let CAI-1 as entity A and fusion kinase as entity B then the rate of reaction can given as:
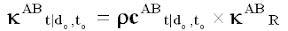
 is the probability of interaction between CAI-1 and Fusion Kinase. is the probability of interaction between CAI-1 and Fusion Kinase.
 is the reaction once CAI-1 has interacted with Fusion Kinase. is the reaction once CAI-1 has interacted with Fusion Kinase.
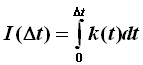
This interaction will follow the law of diffusion and if we let the process under consideration as Poisson process, the probability can be given as: 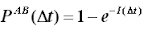
To find the probability of rest of reaction i.e. from activation of UvrY till the shining of our protein we can use the Gaussian Distribution, which can be given as: 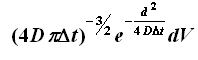
|

|
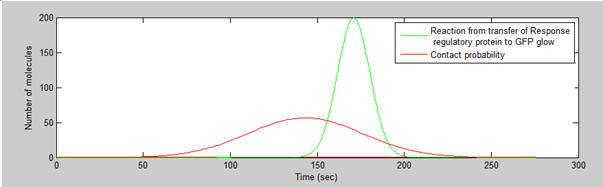
The red curve is nearly half times wider than the green curve. It follows that standard deviation of red curve is greater thus the probability of contact (CAI-1 with Fusion kinase) is nearly half as compared to the probability of rest of reaction. To understand this consider an example of biscuits. Red curve shows each a biscuit made is different to the other produced under same conditions whereas green curve shows that the probability of two biscuits to be same is high. . |