Team:Bologna/Modeling
From 2008.igem.org
(→Equibrium conditions) |
(→Mathematical Model) |
||
| Line 29: | Line 29: | ||
<br> | <br> | ||
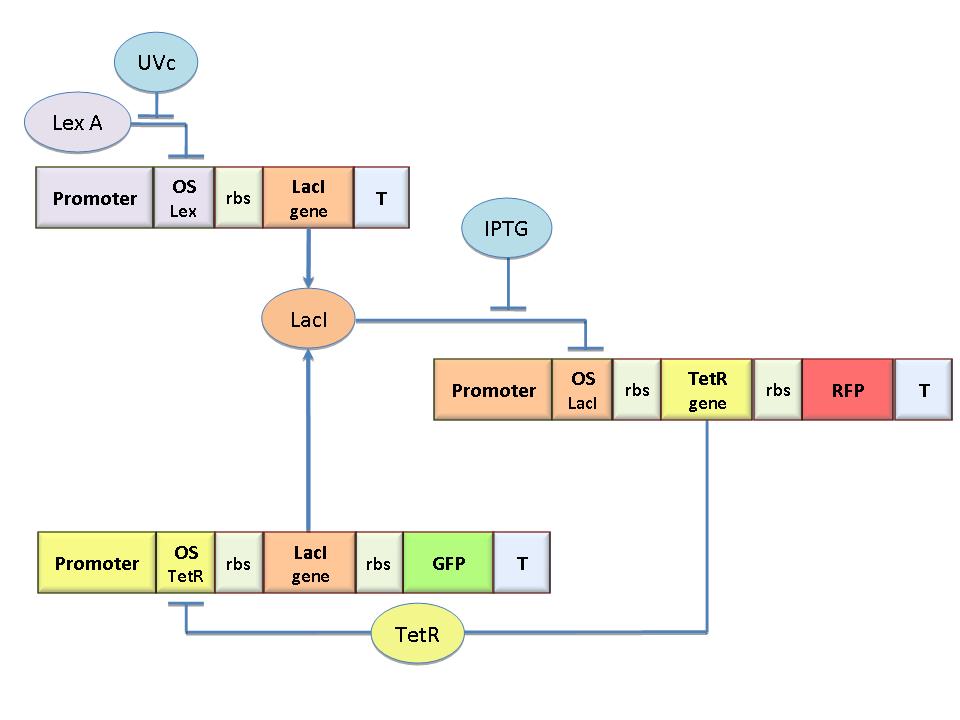
| - | [[Image:Circuito2.jpg|300px|thumb| | + | [[Image:Circuito2.jpg|300px|thumb|right|Figure 1: Genetic flip-flop]] |
<br> | <br> | ||
Revision as of 15:04, 17 October 2008
| HOME | THE PROJECT | THE TEAM | PARTS SUBMITTED TO THE REGISTRY | MODELING | NOTEBOOK | BIOSAFETY |
|---|
Contents |
Model based on the analysis of the circuit Flip-Flop
Mathematical Model
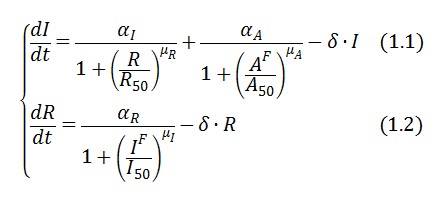
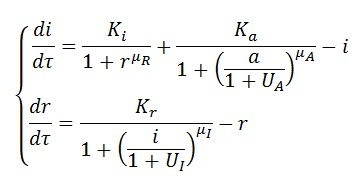
The circuit in Figure 1 can be modeled with the following equations:
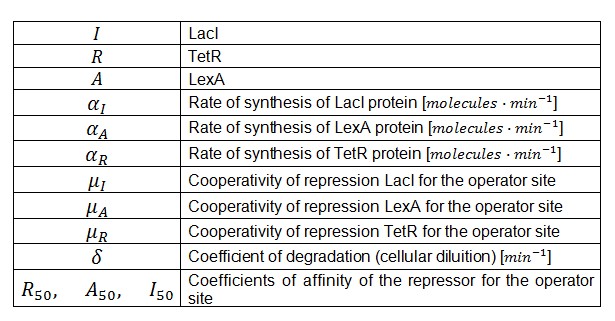
Where:
In the model we distinguish between LacI protein binded to repressor IPTG ![]() and protein free
and protein free ![]() .
.
Since ![]() and considering the law of mass action
and considering the law of mass action ![]() we can write:
we can write:
Adimensional equations
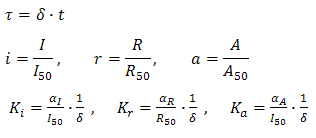
Posing:
The equations (1.1) and (1.2) can be written in adimensional form:
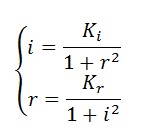
Equibrium conditions
If we assume under equilibrium conditions ![]() , with null input
, with null input ![]() , the affinity
, the affinity ![]() (
(![]() ) and the cooperativity is the same both for the LacI and for TetR and it is worth 2, then the equilibrium conditions are:
) and the cooperativity is the same both for the LacI and for TetR and it is worth 2, then the equilibrium conditions are:
The figure 2 has been gotten with both the aces in logarithmic staircase and hypothesizing that ![]() . There are three point of equilibrium, the blue points to the extreme are stable while the red point to the center is unstable. If we maintain constant a parameter (
. There are three point of equilibrium, the blue points to the extreme are stable while the red point to the center is unstable. If we maintain constant a parameter (![]() or
or ![]() ) and we make to vary the other is possible to notice that all of a sudden a bifurcation is had, because from three points of equilibrium us neither only one stable.
) and we make to vary the other is possible to notice that all of a sudden a bifurcation is had, because from three points of equilibrium us neither only one stable.
If it is set ![]() it is possible to get figure 3 in which an only point of stable equilibrium is had. This means that is present so much TetR inside the cell and there is little LacI because the gene of LacI is inhibited from the protein TetR that has been synthesized thanks to the entry of IPTG inside the cell.
it is possible to get figure 3 in which an only point of stable equilibrium is had. This means that is present so much TetR inside the cell and there is little LacI because the gene of LacI is inhibited from the protein TetR that has been synthesized thanks to the entry of IPTG inside the cell.
If instead it is hypothesized that ![]() it is possible to get the figure 4 in which an only point of stable equilibrium is had. This means that has been produced a lot of LacI that has gone to inhibit the gene that synthesizes TetR after having induced the cell with the UVc. This new point of equilibrium represents the state in which LacI is ON while TetR is OFF.
it is possible to get the figure 4 in which an only point of stable equilibrium is had. This means that has been produced a lot of LacI that has gone to inhibit the gene that synthesizes TetR after having induced the cell with the UVc. This new point of equilibrium represents the state in which LacI is ON while TetR is OFF.
Bifurcation lines are illustrated in figure 6 for three different values of cooperativity (1.5, 2, 2.5). It is supposed that the cooperativity is always the same one both for LacI and for TetR. The figure 6 is always gotten in logarithmic staircase in function of (![]() and
and ![]() ). The bistable region lies inside of each pair of curves.
). The bistable region lies inside of each pair of curves.
Reducing the cooperativity of repression reduces the size of the bistable region.
 "
"


