Team:NTU-Singapore/Parts/Characterization of LacI-GFP
From 2008.igem.org
Lalala8585 (Talk | contribs) (→Results obtained at 37°C (Graph 4-2)) |
Lalala8585 (Talk | contribs) |
||
| (6 intermediate revisions not shown) | |||
| Line 6: | Line 6: | ||
| - | =Characterization of the existing | + | ='''Characterization of the existing pLacI part (BBa_R0010)'''= |
| - | ==Results obtained at 25°C (Graph 4-1)== | + | For the protocol of the characterization experiment, please click on the file: [[Image:NTU@iGEM Characterization Protocol.pdf]]<br> |
| + | Link to the registry for Biobrick part:[http://partsregistry.org/wiki/index.php?title=Part:BBa_R0010 BBa_R0010] | ||
| + | [[Image:NTU@iGEM_PLacI_GFP_pic.JPG|center|thumb|400px|pLacI promoter with GFP reporting gene]] | ||
| + | ==''Results obtained at 25°C (Graph 4-1)''== | ||
[[Image:NTU@IGEM_LacI-GFP_25_deg_normal.JPG|900px|thumb|center|Characterization of pLaci-GFP at 25°C]] | [[Image:NTU@IGEM_LacI-GFP_25_deg_normal.JPG|900px|thumb|center|Characterization of pLaci-GFP at 25°C]] | ||
| - | '''Observations''' | + | '''Observations'''<br> |
From the graph 4-1 of RFU vs. Lactose Concentration for the experiment conducted at 25°C, we could deduce the following: | From the graph 4-1 of RFU vs. Lactose Concentration for the experiment conducted at 25°C, we could deduce the following: | ||
| - | 1) For all concentration of Lactose (0 to 10mM), there were initial dips in RFU readings. This could be due the cells accommodating to | + | 1) For all concentration of Lactose (0 to 10mM), there were initial dips in RFU readings. This could be due the cells accommodating to an environment that was of a different medium and temperature. As previously, the cells were incubated at 37°C and in LB medium, but during the RFU measurement, the temperature was 25° and M9 medium was used instead. |
| - | 2) After about 90 minutes, the RFU readings start to increase. The cells most likely have become accustomed to the new environment. The effects of the Lactose inoculation took place, activating the | + | 2) After about 90 minutes, the RFU readings start to increase. The cells most likely have become accustomed to the new environment. The effects of the Lactose inoculation took place, activating the pLacI promoter and thus producing GFP proteins which led to a higher RFU measurement. |
3) An interesting observation was made. As more readings were taken over time, the effect of Lactose concentration was more significant for cells that were subjected to lower Lactose concentration. As shown in Graph 4-1, we could see that the RFU readings for lower concentration of Lactose were higher than that for the cells inoculated with a higher concentration of Lactose. | 3) An interesting observation was made. As more readings were taken over time, the effect of Lactose concentration was more significant for cells that were subjected to lower Lactose concentration. As shown in Graph 4-1, we could see that the RFU readings for lower concentration of Lactose were higher than that for the cells inoculated with a higher concentration of Lactose. | ||
| Line 21: | Line 24: | ||
4) After approximately 400 minutes, the RFU readings generally become constant with slight fluctuations observed. This could be due to the cells reaching saturation where the lactose in the environment would not further increase the amount of GFP protein formed. Another reason could be due the cell reaching stationary phrase, where the cells would not be affected by the lactose in their environment. | 4) After approximately 400 minutes, the RFU readings generally become constant with slight fluctuations observed. This could be due to the cells reaching saturation where the lactose in the environment would not further increase the amount of GFP protein formed. Another reason could be due the cell reaching stationary phrase, where the cells would not be affected by the lactose in their environment. | ||
| - | ==Results obtained at 37°C (Graph 4-2)== | + | ==''Results obtained at 37°C (Graph 4-2)''== |
[[Image:NTU@IGEM_LacI-GFP_37_deg_normal.JPG|thumb|center|900px|Characterization of pLaci-GFP at 37°C]] | [[Image:NTU@IGEM_LacI-GFP_37_deg_normal.JPG|thumb|center|900px|Characterization of pLaci-GFP at 37°C]] | ||
| - | '''Observations''' | + | '''Observations'''<br> |
From the graph 4-2 of RFU vs. Lactose Concentration for the experiment conducted at 37°C, we could deduce the following: | From the graph 4-2 of RFU vs. Lactose Concentration for the experiment conducted at 37°C, we could deduce the following: | ||
| Line 30: | Line 33: | ||
2) After about 90 minutes, the RFU readings start to increase. A similar observation was made for the cells that were subjected to a temperature of 25°C in the previous experiment. | 2) After about 90 minutes, the RFU readings start to increase. A similar observation was made for the cells that were subjected to a temperature of 25°C in the previous experiment. | ||
| - | |||
3) As more readings were taken over time, the effect of Lactose concentration was more prominent for the cells that were subjected to higher Lactose inoculation. As shown in Graph 4-2, we could see that the RFU readings for higher concentration of Lactose were higher than that for lower concentration of Lactose. This result shows that an increase in the amount of lactose would cause an increase in LacI promoter activity. This is proven by an increase in RFU readings. This result was unlike those observed for the experiment done at 25°C. | 3) As more readings were taken over time, the effect of Lactose concentration was more prominent for the cells that were subjected to higher Lactose inoculation. As shown in Graph 4-2, we could see that the RFU readings for higher concentration of Lactose were higher than that for lower concentration of Lactose. This result shows that an increase in the amount of lactose would cause an increase in LacI promoter activity. This is proven by an increase in RFU readings. This result was unlike those observed for the experiment done at 25°C. | ||
| Line 36: | Line 38: | ||
4) After approximately 400 minutes, the RFU readings generally become constant with slight fluctuations observed, similar to the results found in 25°C (Graph 4-1). | 4) After approximately 400 minutes, the RFU readings generally become constant with slight fluctuations observed, similar to the results found in 25°C (Graph 4-1). | ||
| - | ===Verification=== | + | ==='''Verification'''=== |
The above observations could also be simply due to the multiplication of cells over time, hence with an increase in cell number, there would be also an increase in basal amount of GFP produced. Furthermore, with an increase in lactose concentration, the cells would have more nutrients for its growth. | The above observations could also be simply due to the multiplication of cells over time, hence with an increase in cell number, there would be also an increase in basal amount of GFP produced. Furthermore, with an increase in lactose concentration, the cells would have more nutrients for its growth. | ||
| Line 42: | Line 44: | ||
| - | [[Image:NTU@iGEM_Fluorscence_LacI-GFP_1mM.JPG|thumb|center|500px|Fluorescence Microscope picture of | + | [[Image:NTU@iGEM_Fluorscence_LacI-GFP_1mM.JPG|thumb|center|500px|Fluorescence Microscope picture of pLacI-GFP at 1.0mM Lactose concentration]] |
| - | [[Image:NTU@iGEM_Fluorscence_LacI-GFP_10mM.JPG|thumb|center|500px|Fluorescence Microscope picture of | + | [[Image:NTU@iGEM_Fluorscence_LacI-GFP_10mM.JPG|thumb|center|500px|Fluorescence Microscope picture of pLacI-GFP at 10.0mM Lactose concentration]] |
==Results obtained at 42°C (Graph 4-3)== | ==Results obtained at 42°C (Graph 4-3)== | ||
| - | [[Image:NTU@IGEM_LacI-GFP_42_deg_normal.JPG.jpg|900px]] | + | [[Image:NTU@IGEM_LacI-GFP_42_deg_normal.JPG.jpg|thumb|center|900px|Characterization of pLaci-GFP at 42°C]] |
'''Observations''' | '''Observations''' | ||
| Line 54: | Line 56: | ||
1) For all concentration of Lactose (0 to 10mM), there were initial dips in RFU readings. | 1) For all concentration of Lactose (0 to 10mM), there were initial dips in RFU readings. | ||
| + | |||
2) The normalized RFU readings for 42°C (ranging from -15 to 40) were generally lower than those obtained for 25°C (ranging from -50 to 150) and for 37°C (ranging from 0 to 500). This small range increased could be due to the relatively low activity when the temperature was at 42°C. The low activity showed that at 42°C, the condition was not conducive for the cells to express the GFP protein. | 2) The normalized RFU readings for 42°C (ranging from -15 to 40) were generally lower than those obtained for 25°C (ranging from -50 to 150) and for 37°C (ranging from 0 to 500). This small range increased could be due to the relatively low activity when the temperature was at 42°C. The low activity showed that at 42°C, the condition was not conducive for the cells to express the GFP protein. | ||
3) After about 50 minutes, the RFU readings start to increase for all concentration of Lactose. | 3) After about 50 minutes, the RFU readings start to increase for all concentration of Lactose. | ||
| - | 4) As more readings were taken over time, the effect of Lactose concentration was not significantly more for cells that were subjected to higher Lactose concentration. As shown in Graph 4-3, we could see that the RFU readings for higher concentration of Lactose | + | 4) As more readings were taken over time, the effect of Lactose concentration was not significantly more for cells that were subjected to higher Lactose concentration. As shown in Graph 4-3, we could see that the RFU readings for higher concentration of Lactose only deviates from those readings for lower concentration of Lactose by less than 10%. This was different from the result observed when the cells were inoculated at 37°C, suggesting that the temperature does play an important role on how the cells may respond. |
| - | + | ||
5) After approximately 400 minutes, the RFU readings showed trends of increasing, though the increase was minimal. This was not similar to the results obtained in 25°C (Graph 4-1) and 37°C (Graph 4-2). Again the temperature could be the main reason why the cells are behaving in this manner. | 5) After approximately 400 minutes, the RFU readings showed trends of increasing, though the increase was minimal. This was not similar to the results obtained in 25°C (Graph 4-1) and 37°C (Graph 4-2). Again the temperature could be the main reason why the cells are behaving in this manner. | ||
| - | ==Measurement compared to Standard Promoters== | + | =='''Measurement compared to Standard Promoters'''== |
| - | ===RFU Measurements After 3 hours=== | + | ==='''RFU Measurements After 3 hours'''=== |
====For Lactose induction of 0 to 10 mM==== | ====For Lactose induction of 0 to 10 mM==== | ||
[[Image:NTU@iGEM LacI-GFP RFU Chart 3 hours.JPG|thumb|center|700px|Characterization Graph of LacI-GFP after 3 hours]] | [[Image:NTU@iGEM LacI-GFP RFU Chart 3 hours.JPG|thumb|center|700px|Characterization Graph of LacI-GFP after 3 hours]] | ||
| - | ====A comparision of the Standards promoters with | + | ====A comparision of the Standards promoters with pLacI==== |
[[Image:NTU@iGEM_Standard_promoter_with_LacI-GFP_RFU_Chart_3_hours.JPG|thumb|center|700px|Characterization Graph of Standards & LacI-GFP after 3 hours]] | [[Image:NTU@iGEM_Standard_promoter_with_LacI-GFP_RFU_Chart_3_hours.JPG|thumb|center|700px|Characterization Graph of Standards & LacI-GFP after 3 hours]] | ||
| Line 75: | Line 77: | ||
[[Image:NTU@iGEM_Promoter_Practice_Set.png|thumb|center|900px|Practice promoter set included with the measurement kit to practice characterization.]] | [[Image:NTU@iGEM_Promoter_Practice_Set.png|thumb|center|900px|Practice promoter set included with the measurement kit to practice characterization.]] | ||
| - | ===RFU Measurements After 3.5 hours=== | + | ==='''RFU Measurements After 3.5 hours'''=== |
====For Lactose induction of 0 to 10 mM==== | ====For Lactose induction of 0 to 10 mM==== | ||
[[Image:NTU@iGEM_LacI-GFP_RFU_Chart_3.5_hours.JPG|thumb|center|700px|Characterization Graph of LacI-GFP after 3.5 hours]] | [[Image:NTU@iGEM_LacI-GFP_RFU_Chart_3.5_hours.JPG|thumb|center|700px|Characterization Graph of LacI-GFP after 3.5 hours]] | ||
| - | ==== | + | ====A comparision of the Standards promoters with pLacI==== |
[[Image:NTU@iGEM_Standard_promoter_with_LacI-GFP_RFU_Chart_3.5_hours.JPG|thumb|center|700px|Characterization Graph of Standards & LacI-GFP after 3.5 hours]] | [[Image:NTU@iGEM_Standard_promoter_with_LacI-GFP_RFU_Chart_3.5_hours.JPG|thumb|center|700px|Characterization Graph of Standards & LacI-GFP after 3.5 hours]] | ||
| + | |||
| + | The detailed data points and graphs shown above can be retrieved from the [[image: NTU@iGEM_Results_for_characterization_pLacI_010708.xls]]. | ||
| + | <br><br> | ||
| + | <html> | ||
| + | <script language=Javascript1.2> | ||
| + | <!-- | ||
| + | |||
| + | var tags_before_clock = "<b>It is now " | ||
| + | var tags_middle_clock = "on" | ||
| + | var tags_after_clock = "</b>" | ||
| + | |||
| + | if(navigator.appName == "Netscape") { | ||
| + | document.write('<layer id="clock"></layer><br>'); | ||
| + | } | ||
| + | |||
| + | if (navigator.appVersion.indexOf("MSIE") != -1){ | ||
| + | document.write('<span id="clock"></span>'); | ||
| + | } | ||
| + | |||
| + | DaysofWeek = new Array() | ||
| + | DaysofWeek[0]="Sunday" | ||
| + | DaysofWeek[1]="Monday" | ||
| + | DaysofWeek[2]="Tuesday" | ||
| + | DaysofWeek[3]="Wednesday" | ||
| + | DaysofWeek[4]="Thursday" | ||
| + | DaysofWeek[5]="Friday" | ||
| + | DaysofWeek[6]="Saturday" | ||
| + | |||
| + | Months = new Array() | ||
| + | Months[0]="January" | ||
| + | Months[1]="February" | ||
| + | Months[2]="March" | ||
| + | Months[3]="April" | ||
| + | Months[4]="May" | ||
| + | Months[5]="June" | ||
| + | Months[6]="July" | ||
| + | Months[7]="August" | ||
| + | Months[8]="September" | ||
| + | Months[9]="October" | ||
| + | Months[10]="November" | ||
| + | Months[11]="December" | ||
| + | |||
| + | function upclock(){ | ||
| + | var dte = new Date(); | ||
| + | var hrs = dte.getHours(); | ||
| + | var min = dte.getMinutes(); | ||
| + | var sec = dte.getSeconds(); | ||
| + | var day = DaysofWeek[dte.getDay()] | ||
| + | var date = dte.getDate() | ||
| + | var month = Months[dte.getMonth()] | ||
| + | var year = dte.getFullYear() | ||
| + | |||
| + | var col = ":"; | ||
| + | var spc = " "; | ||
| + | var com = ","; | ||
| + | var apm; | ||
| + | |||
| + | if (date == 1 || date == 21 || date == 31) | ||
| + | {ender = "<sup>st</sup>"} | ||
| + | else | ||
| + | if (date == 2 || date == 22) | ||
| + | {ender = "<sup>nd</sup>"} | ||
| + | else | ||
| + | if (date == 3 || date == 23) | ||
| + | {ender = "<sup>rd</sup>"} | ||
| + | |||
| + | else | ||
| + | {ender = "<sup>th</sup>"} | ||
| + | |||
| + | if (12 < hrs) { | ||
| + | apm="<font size='-1'>pm</font>"; | ||
| + | hrs-=12; | ||
| + | } | ||
| + | |||
| + | else { | ||
| + | apm="<font size='-1'>am</font>"; | ||
| + | } | ||
| + | |||
| + | if (hrs == 0) hrs=12; | ||
| + | if (hrs<=9) hrs="0"+hrs; | ||
| + | if (min<=9) min="0"+min; | ||
| + | if (sec<=9) sec="0"+sec; | ||
| + | |||
| + | if(navigator.appName == "Netscape") { | ||
| + | document.clock.document.write(tags_before_clock+hrs+col+min+col+sec+apm+spc+tags_middle_clock+spc+day+com+spc+date+ender+spc+month+com+spc+year+tags_after_clock); | ||
| + | document.clock.document.close(); | ||
| + | } | ||
| + | |||
| + | if (navigator.appVersion.indexOf("MSIE") != -1){ | ||
| + | clock.innerHTML = tags_before_clock+hrs+col+min+col+sec+apm+spc+tags_middle_clock+spc+day+com+spc+date+ender+spc+month+com+spc+year+tags_after_clock; | ||
| + | } | ||
| + | } | ||
| + | |||
| + | setInterval("upclock()",1000); | ||
| + | //--> | ||
| + | </script> | ||
| + | </html> | ||
Latest revision as of 05:49, 27 October 2008
|
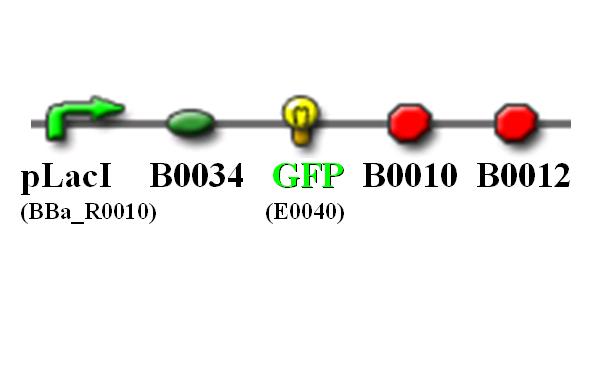
Characterization of the existing pLacI part (BBa_R0010)
For the protocol of the characterization experiment, please click on the file: File:NTU@iGEM Characterization Protocol.pdf
Link to the registry for Biobrick part:BBa_R0010
Results obtained at 25°C (Graph 4-1)
Observations
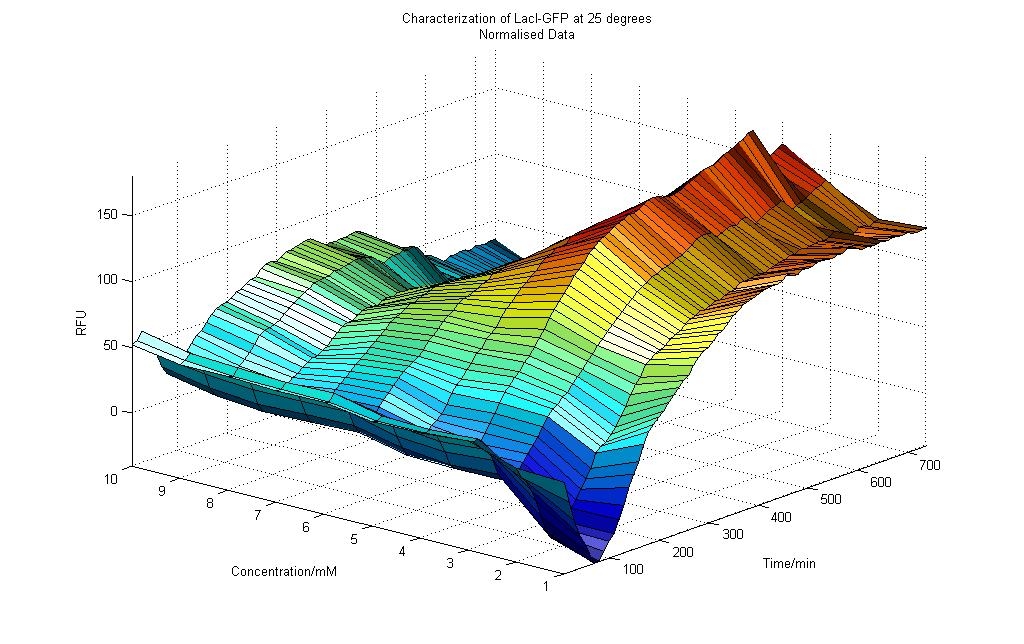
From the graph 4-1 of RFU vs. Lactose Concentration for the experiment conducted at 25°C, we could deduce the following:
1) For all concentration of Lactose (0 to 10mM), there were initial dips in RFU readings. This could be due the cells accommodating to an environment that was of a different medium and temperature. As previously, the cells were incubated at 37°C and in LB medium, but during the RFU measurement, the temperature was 25° and M9 medium was used instead.
2) After about 90 minutes, the RFU readings start to increase. The cells most likely have become accustomed to the new environment. The effects of the Lactose inoculation took place, activating the pLacI promoter and thus producing GFP proteins which led to a higher RFU measurement.
3) An interesting observation was made. As more readings were taken over time, the effect of Lactose concentration was more significant for cells that were subjected to lower Lactose concentration. As shown in Graph 4-1, we could see that the RFU readings for lower concentration of Lactose were higher than that for the cells inoculated with a higher concentration of Lactose.
4) After approximately 400 minutes, the RFU readings generally become constant with slight fluctuations observed. This could be due to the cells reaching saturation where the lactose in the environment would not further increase the amount of GFP protein formed. Another reason could be due the cell reaching stationary phrase, where the cells would not be affected by the lactose in their environment.
Results obtained at 37°C (Graph 4-2)
Observations
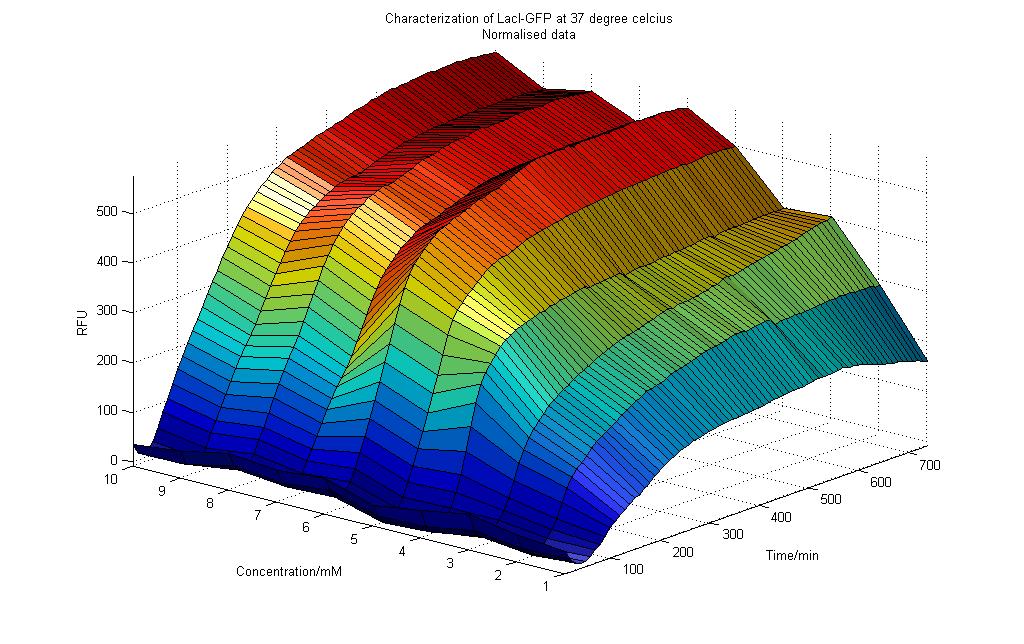
From the graph 4-2 of RFU vs. Lactose Concentration for the experiment conducted at 37°C, we could deduce the following:
1) For all concentration of Lactose (0 to 10mM), there were initial dips in RFU readings. This could be due the cells accommodating to a environment that was of a different medium. Previously the cell was incubated in LB medium. In this experiment M9 medium was used instead as it would not auto-fluoresce.
2) After about 90 minutes, the RFU readings start to increase. A similar observation was made for the cells that were subjected to a temperature of 25°C in the previous experiment.
3) As more readings were taken over time, the effect of Lactose concentration was more prominent for the cells that were subjected to higher Lactose inoculation. As shown in Graph 4-2, we could see that the RFU readings for higher concentration of Lactose were higher than that for lower concentration of Lactose. This result shows that an increase in the amount of lactose would cause an increase in LacI promoter activity. This is proven by an increase in RFU readings. This result was unlike those observed for the experiment done at 25°C.
4) After approximately 400 minutes, the RFU readings generally become constant with slight fluctuations observed, similar to the results found in 25°C (Graph 4-1).
Verification
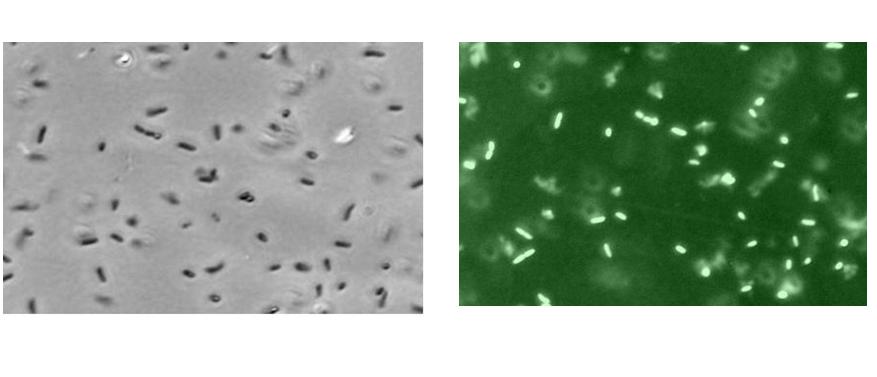
The above observations could also be simply due to the multiplication of cells over time, hence with an increase in cell number, there would be also an increase in basal amount of GFP produced. Furthermore, with an increase in lactose concentration, the cells would have more nutrients for its growth.
In order to investigate this further, the fluorescence microscope pictures shown below were taken for the varying concentration of lactose. From the diagram below, it could be seen that the E Coli cells at 10mM lactose concentration fluoresce brighter than those at 1mM lactose concentration. This shows that the effect of increasing the lactose concentration resulted in more GFP formed and hence a higher RFU reading.
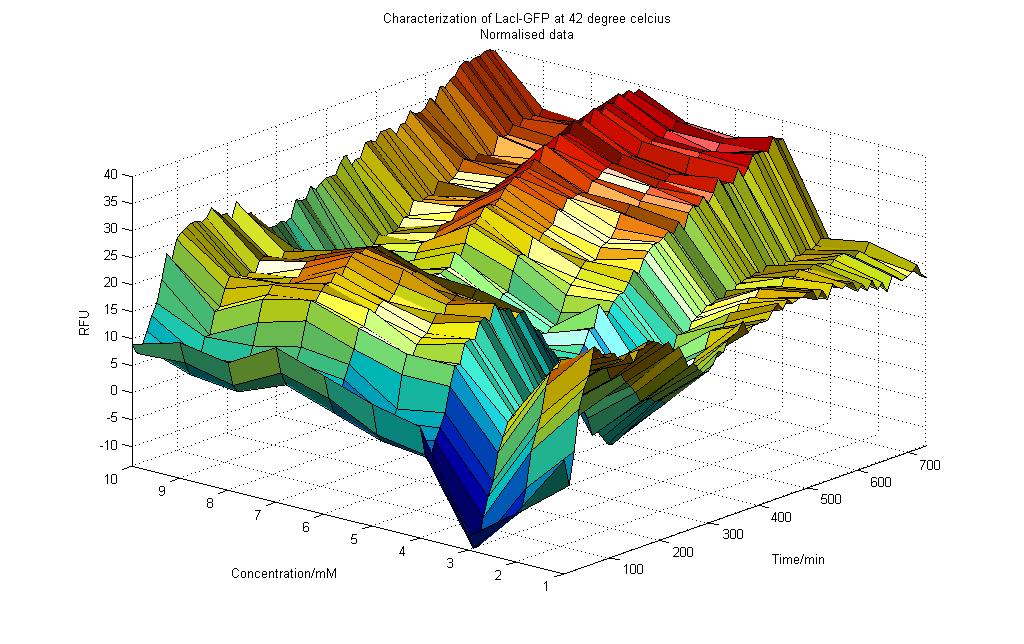
Results obtained at 42°C (Graph 4-3)
Observations From the graph 4-3 of RFU vs. Lactose Concentration for the experiment conducted at 42°C, we could deduce the following:
1) For all concentration of Lactose (0 to 10mM), there were initial dips in RFU readings.
2) The normalized RFU readings for 42°C (ranging from -15 to 40) were generally lower than those obtained for 25°C (ranging from -50 to 150) and for 37°C (ranging from 0 to 500). This small range increased could be due to the relatively low activity when the temperature was at 42°C. The low activity showed that at 42°C, the condition was not conducive for the cells to express the GFP protein.
3) After about 50 minutes, the RFU readings start to increase for all concentration of Lactose.
4) As more readings were taken over time, the effect of Lactose concentration was not significantly more for cells that were subjected to higher Lactose concentration. As shown in Graph 4-3, we could see that the RFU readings for higher concentration of Lactose only deviates from those readings for lower concentration of Lactose by less than 10%. This was different from the result observed when the cells were inoculated at 37°C, suggesting that the temperature does play an important role on how the cells may respond.
5) After approximately 400 minutes, the RFU readings showed trends of increasing, though the increase was minimal. This was not similar to the results obtained in 25°C (Graph 4-1) and 37°C (Graph 4-2). Again the temperature could be the main reason why the cells are behaving in this manner.
Measurement compared to Standard Promoters
RFU Measurements After 3 hours
For Lactose induction of 0 to 10 mM
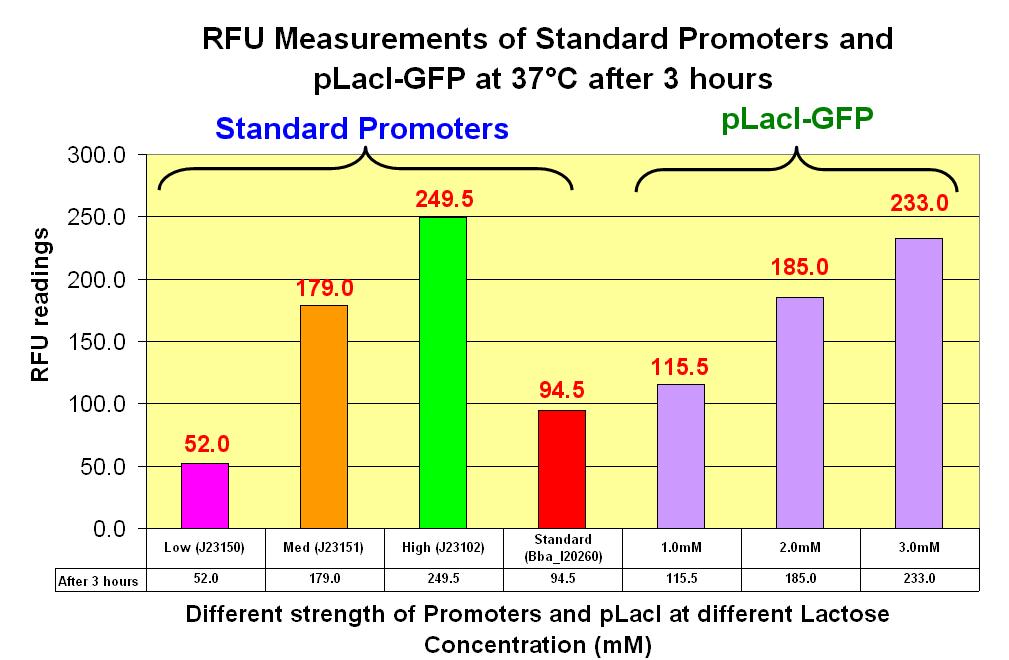
A comparision of the Standards promoters with pLacI
In comparison with the graphs provided in the Measurement Kit
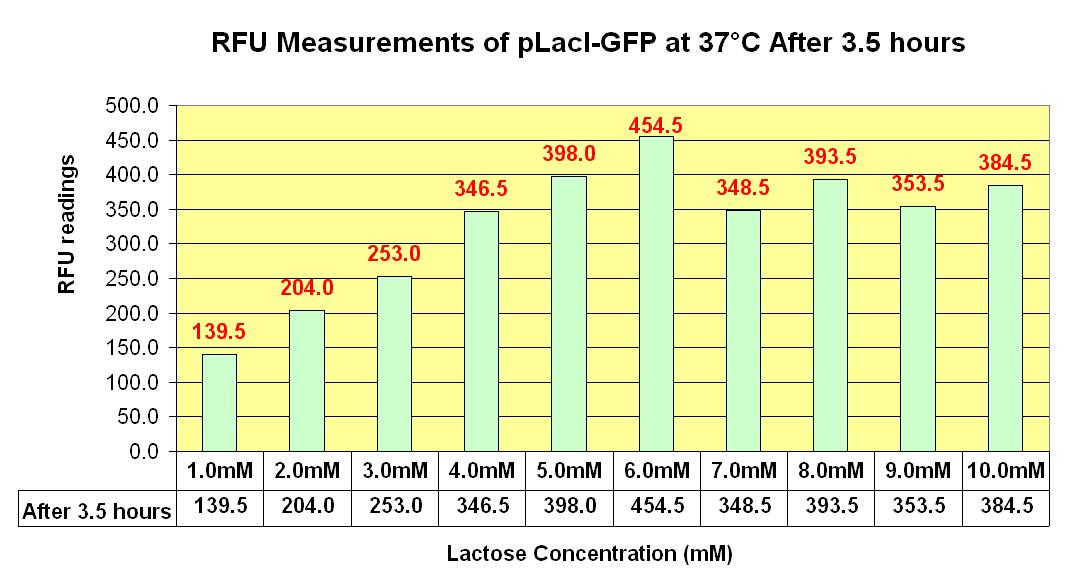
RFU Measurements After 3.5 hours
For Lactose induction of 0 to 10 mM
A comparision of the Standards promoters with pLacI
The detailed data points and graphs shown above can be retrieved from the File:NTU@iGEM Results for characterization pLacI 010708.xls.
 "
"

