Team:NTU-Singapore/Parts/Characterization of LacI-GFP
From 2008.igem.org
|
Contents |
Characterization of the existing LacI-GFP part (BBa_R0010)
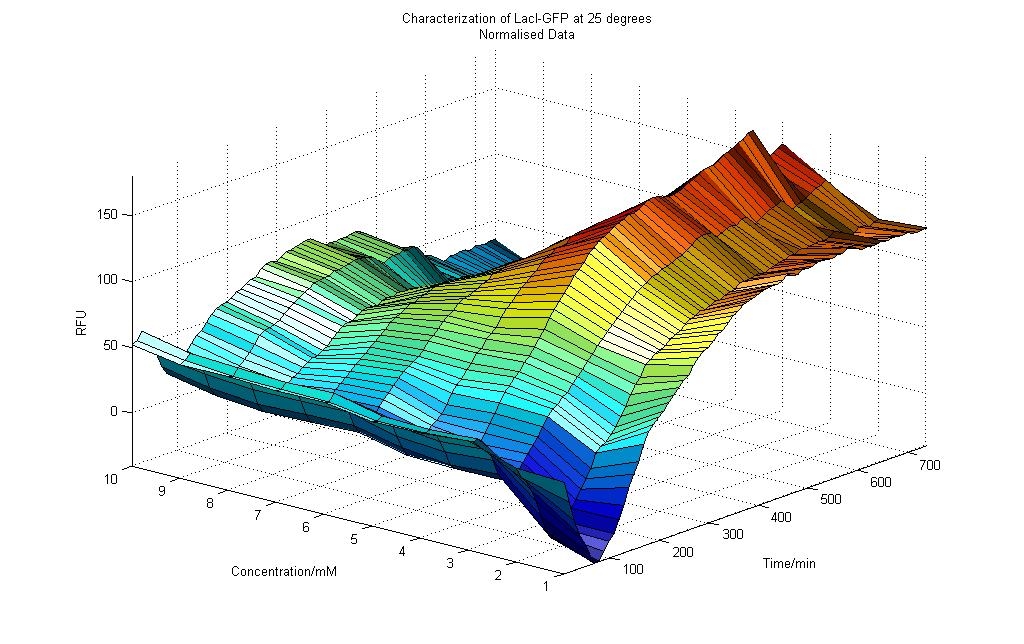
Results obtained at 25°C (Graph 4-1)
From the graph 4-1 of RFU vs. Lactose Concentration for the experiment conducted at 25°C, we could deduce the following:
1) For all concentration of Lactose (0 to 10mM), there were initial dips in RFU readings. This could be due the cells accommodating to a environment that was of a lower temperature than before. As previously, the cells were incubated overnight at 37°C during the preparations of the experiment.
2) After about 90 minutes, the RFU readings start to increase for all concentration of Lactose. This could be due to the fact that the cells were fully accommodated, and were starting to show the effects of the Lactose, the activator of the LacI-GFP promoter, thus producing GFP proteins which led to more RFU measured.
3) A strange observation was observed, as more readings were taken over time, the effect of Lactose concentration was more on cells that were subjected to lower Lactose concentration. As shown in Graph 4-1, we could see that the RFU readings for lower concentration of Lactose were higher than that for higher concentration of Lactose. This puzzling result could be due to the cells being overwhelmed by the high amounts of Lactose.
4) After approximately 400 minutes, the RFU readings generally become constant with slight fluctuations observed. This could be due the cells reaching saturation where the lactose in the environment would not further increase the amount of GFP protein formed. This could also be due the cell reaching stationary phrase, where the cells would not be actively affected by the lactose in the environment.
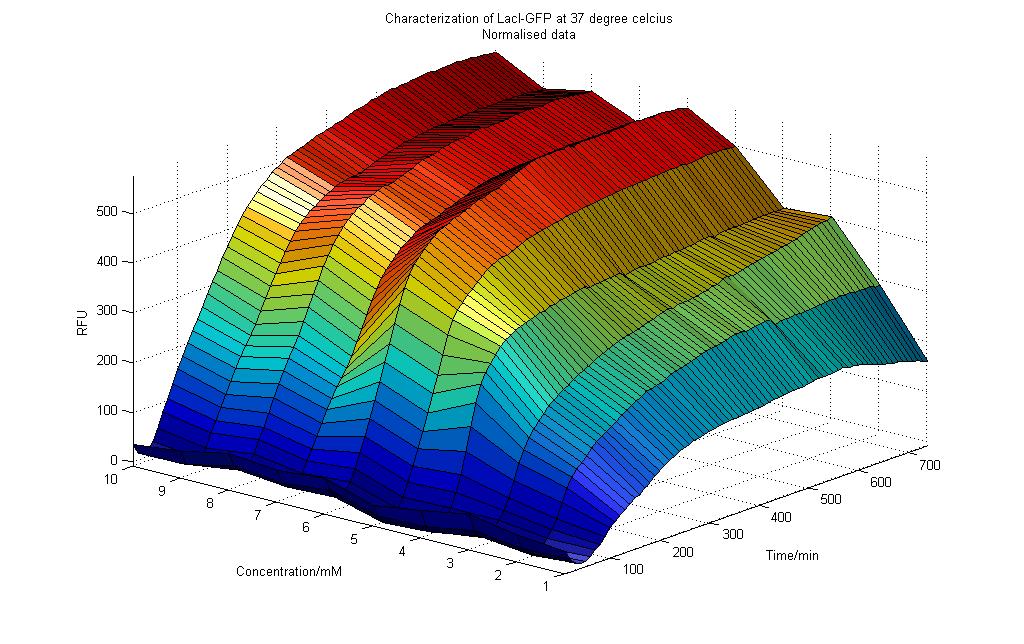
Results obtained at 37°C (Graph 4-2)
From the graph 4-2 of RFU vs. Lactose Concentration for the experiment conducted at 37°C, we could deduce the following: 1) For all concentration of Lactose (0 to 10mM), there were initial dips in RFU readings. This could be due the cells accommodating to a environment that was of a different medium. As previously, the cells were incubated in LB medium, but during the RFU measurement, M9 medium was used instead as it would not auto-fluoresce.
2) After about 90 minutes, the RFU readings start to increase for all concentration of Lactose. This could be due to the fact that the cells were fully accommodated, and were starting to show the effects of the Lactose, the activator of the LacI promoter, thus producing GFP proteins which led to more RFU measured.
3) As more readings were taken over time, the effect of Lactose concentration was more on cells that were subjected to higher Lactose concentration. As shown in Graph 4-2, we could see that the RFU readings for higher concentration of Lactose were higher than that for lower concentration of Lactose. This result could be due the increase in amount of lactose directly caused an increase in LacI promoter activity, which further results in more GFP protein formed and an increase in RFU readings measured.
4) After approximately 400 minutes, the RFU readings generally become constant with slight fluctuations observed, similar to the results found in 25°C (Graph 4-1). This could be due the cells reaching saturation, where lactose in the environment would not further increase the amount of GFP protein formed. This could also be due the cell reaching stationary phrase, where the cells would not be actively affected by the lactose in the environment.
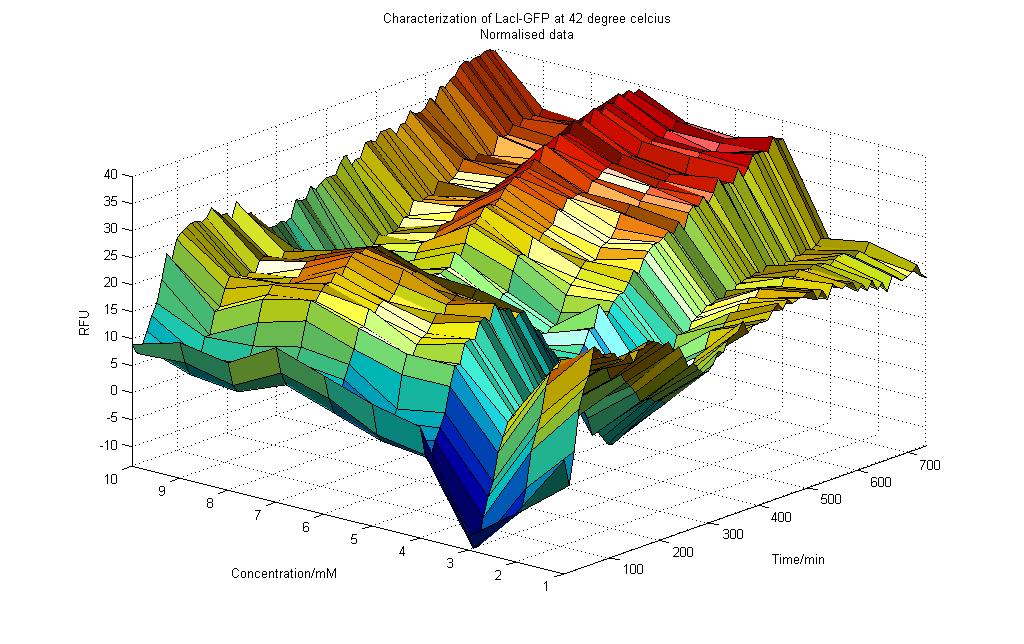
Results obtained at 42°C
Measuring Kit for Standard Promoters
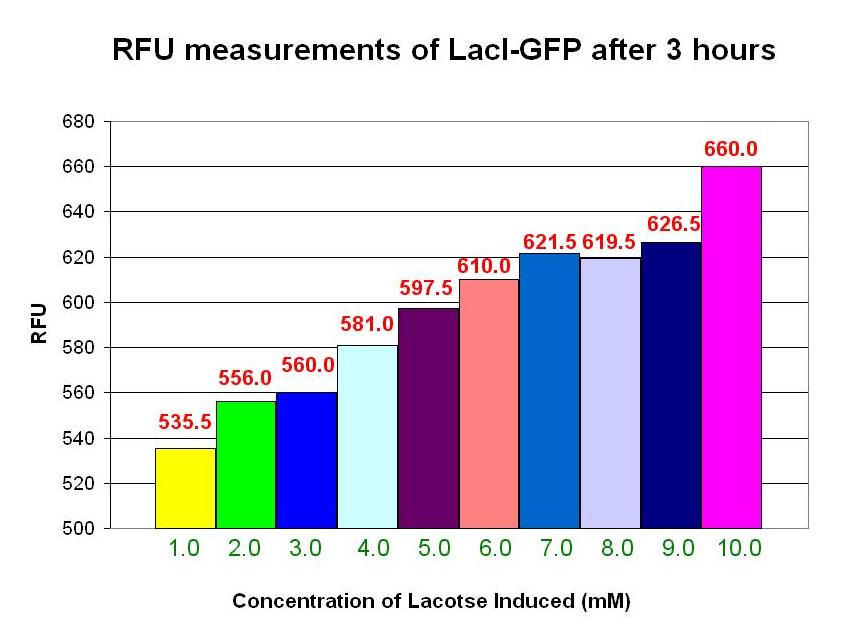
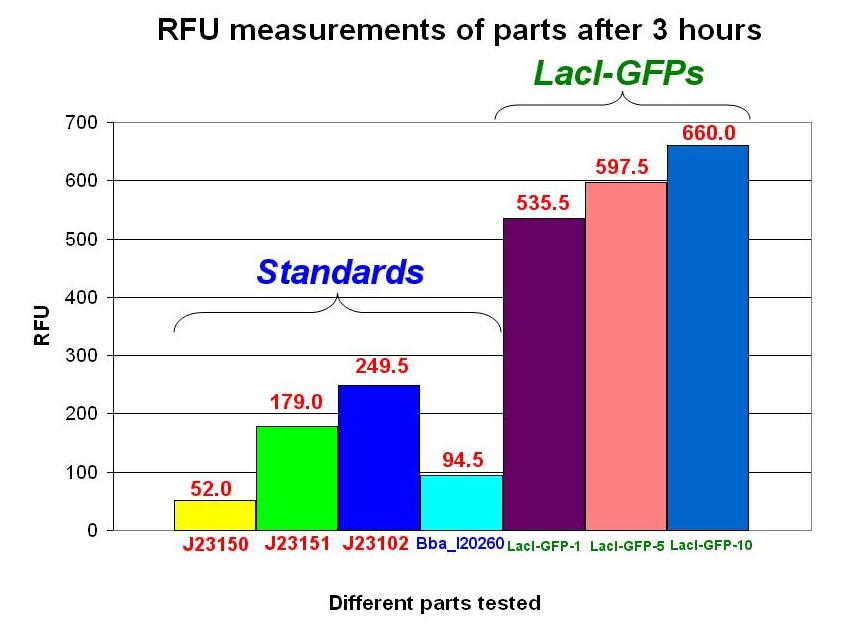
RFU Measurements After 3 hours
For Lactose induction of 0 to 10 mM
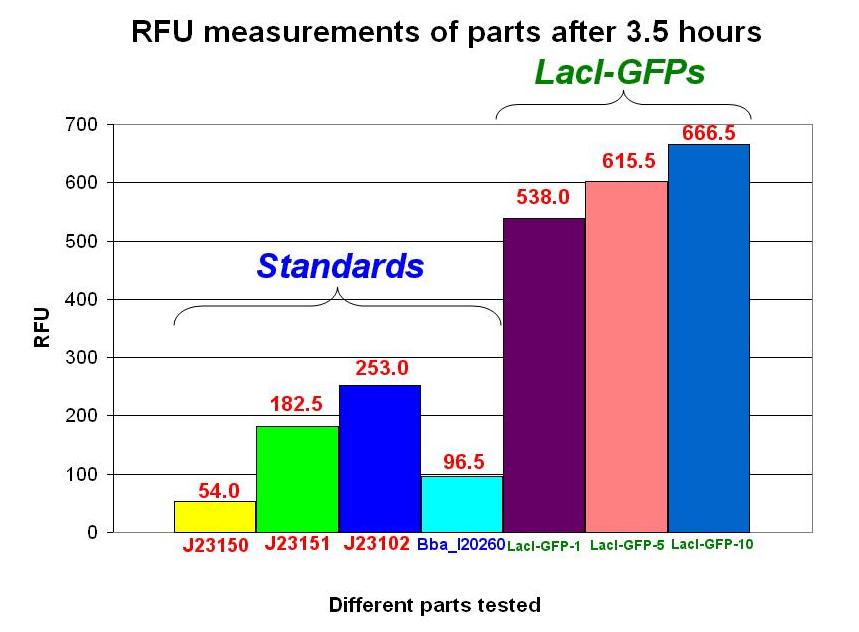
In comparision with the Standards
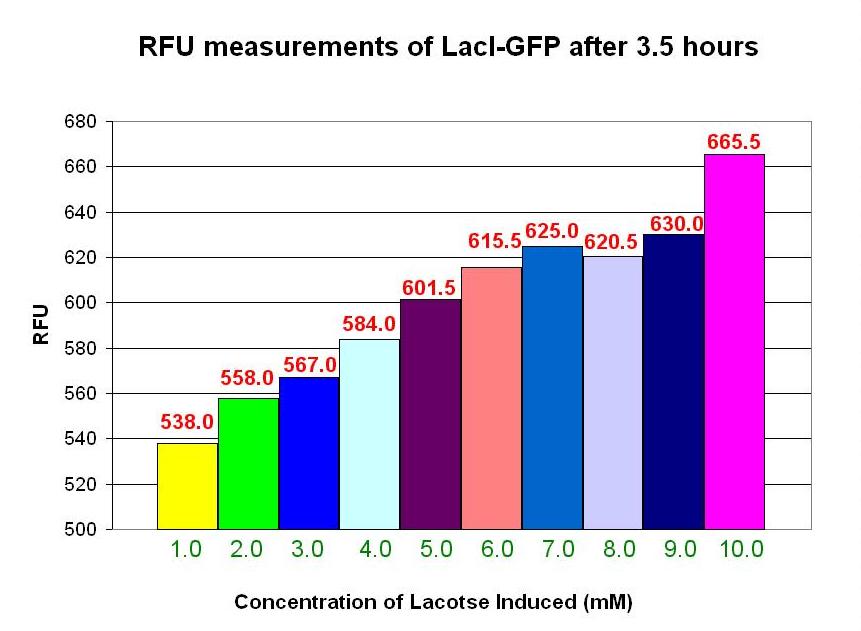
RFU Measurements After 3.5 hours
For Lactose induction of 0 to 10 mM
 "
"

