Team:NTU-Singapore/Parts/Correlation
From 2008.igem.org
Lalala8585 (Talk | contribs) (→Introduction) |
Lalala8585 (Talk | contribs) |
||
| Line 7: | Line 7: | ||
=Introduction= | =Introduction= | ||
| - | |||
| - | |||
Correlations form an integral part in chemical engineering. Many phenomena observed in chemical processes have been extensively studied and relevant data collected to provide correlations between the variables of interest. This is to allow end users to be able to predict certain outcomes based on the knowledge of a specified variable if the correlation is availble. This practise is common when a process is not fully understood and a quick but efficient method to determine the process output is desired. Herein lies the aim of the next part of our project: to find a correlation between the amount of GFP produced and the fluorescence observed. | Correlations form an integral part in chemical engineering. Many phenomena observed in chemical processes have been extensively studied and relevant data collected to provide correlations between the variables of interest. This is to allow end users to be able to predict certain outcomes based on the knowledge of a specified variable if the correlation is availble. This practise is common when a process is not fully understood and a quick but efficient method to determine the process output is desired. Herein lies the aim of the next part of our project: to find a correlation between the amount of GFP produced and the fluorescence observed. | ||
| Line 35: | Line 33: | ||
1) Is the model results truly representative of the real situation? <br> | 1) Is the model results truly representative of the real situation? <br> | ||
2) Will temperature changes have an impact on the results? However it is still possible that our model can account for temperature effects by tweaking the logistic growth input parameter. Recall that our model accounts for varying carrying capacity, and a different temperature could be represented by different paramter values.<br> | 2) Will temperature changes have an impact on the results? However it is still possible that our model can account for temperature effects by tweaking the logistic growth input parameter. Recall that our model accounts for varying carrying capacity, and a different temperature could be represented by different paramter values.<br> | ||
| - | |||
| - | |||
| - | |||
| - | |||
| - | |||
| - | |||
| - | |||
| - | |||
| - | |||
| - | |||
| - | |||
| - | |||
| - | |||
| - | |||
| - | |||
| - | |||
| - | |||
| - | |||
| - | |||
Latest revision as of 01:47, 23 October 2008
|
Introduction
Correlations form an integral part in chemical engineering. Many phenomena observed in chemical processes have been extensively studied and relevant data collected to provide correlations between the variables of interest. This is to allow end users to be able to predict certain outcomes based on the knowledge of a specified variable if the correlation is availble. This practise is common when a process is not fully understood and a quick but efficient method to determine the process output is desired. Herein lies the aim of the next part of our project: to find a correlation between the amount of GFP produced and the fluorescence observed.
Model results and RFU data
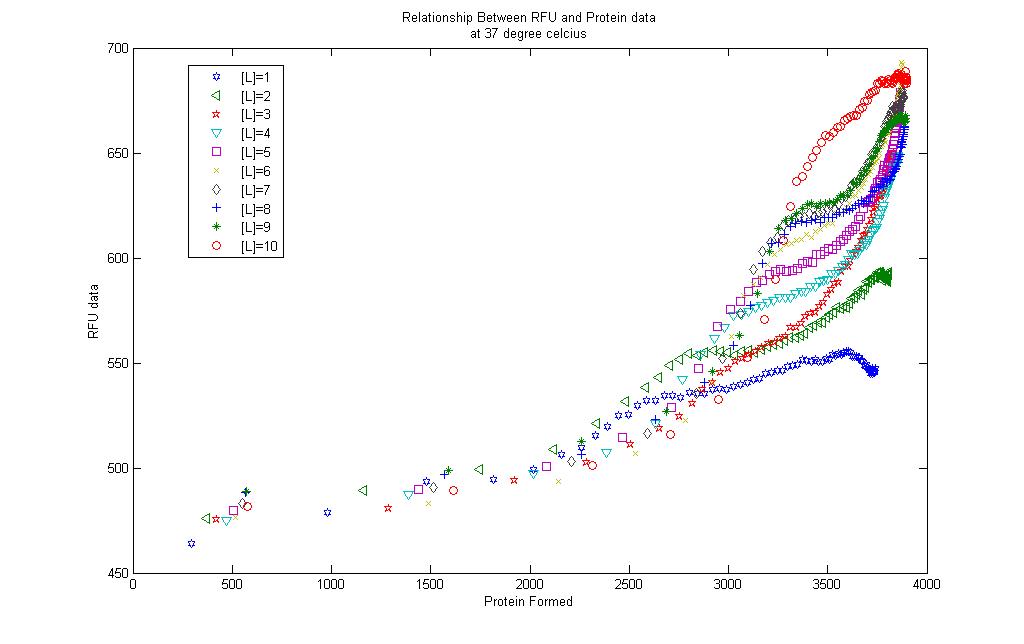
A simple correlation was done between the model results and the RFU collected.
For the 10 graphs, correlations were generated for each of them using the [http://www.mathworks.com/products/curvefitting/ Curve Fitting toolbox] found in MATLAB.
The results are found in each of the links below. Each curve is shown together with the prediction bounds to a 95% cofidence level and the equation of the curve.
Lactose = 1mM
Lactose = 2mM
Lactose = 3mM
Lactose = 4mM
Lactose = 5mM
Lactose = 6mM
Lactose = 7mM
Lactose = 8mM
Lactose = 9mM
Lactose = 10mM
The curves were fitted once a R-square value of higer than 0.99 was obtained. Although the curves could be successfully obtained there remains some questions to be asked:
1) Is the model results truly representative of the real situation?
 "
"

