 "
"
File:Fig 5-081028-controldigestion sender.png
From 2008.igem.org
Size of this preview: 652 × 599 pixels
Full resolution (1,028 × 945 pixels, file size: 206 KB, MIME type: image/png)
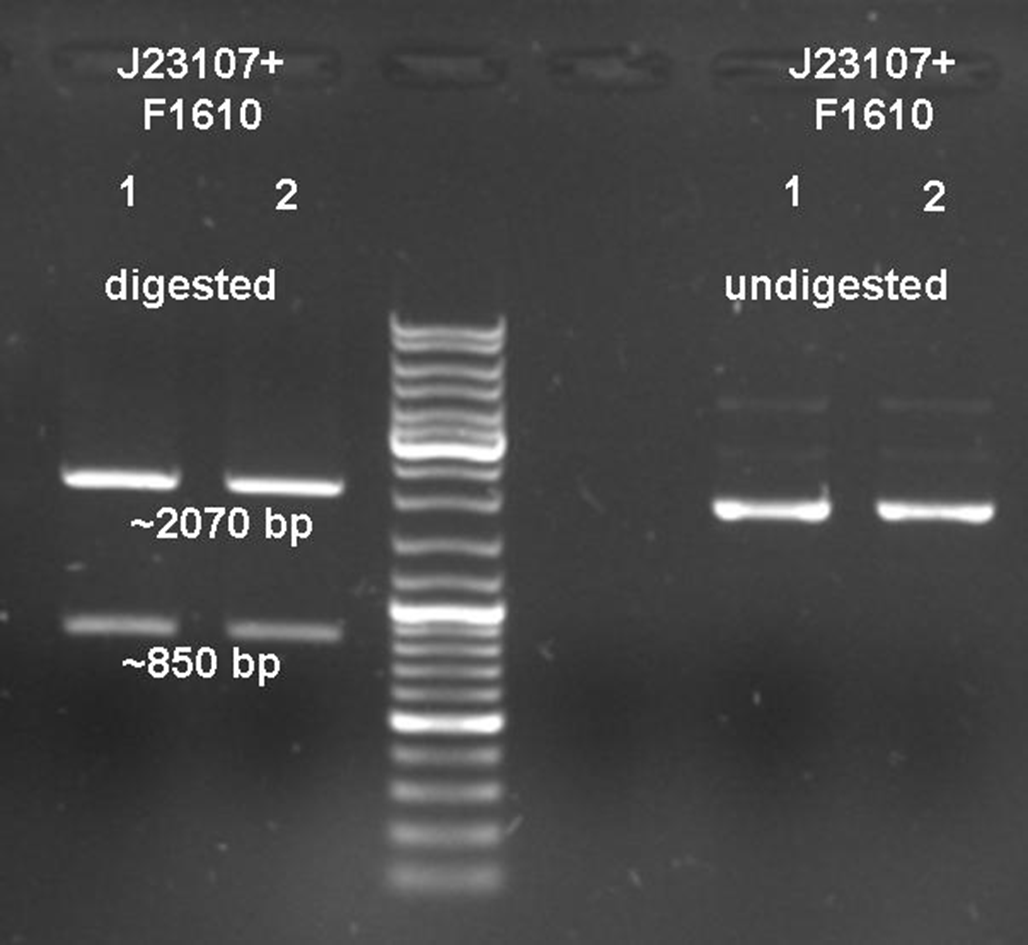
Control digestion of the prey cell cloning (BBa_J23107+BBa_F1610). Bright bands of the DNA ladder from bottom to top: 3000 bp, 1000 bp and 500 bp. Expected bands for the digestion: ~850 bp for the Insert (BBa_J23107+BBa_F1610) and ~2070 bp for the vector (BBa_J61002) at the left hand side of the ladder. Undigested plasmid was loaded on the right hand side as a negative control.
File history
Click on a date/time to view the file as it appeared at that time.
| Date/Time | Thumbnail | Dimensions | User | Comment | |
|---|---|---|---|---|---|
| current | 01:47, 29 October 2008 | | 1,028×945 (206 KB) | Andreaskuehne (Talk | contribs) | (Control digestion of the prey cell cloning (BBa_J23107+BBa_F1610). Bright bands of the DNA ladder from bottom to top: 3000 bp, 1000 bp and 500 bp. Expected bands for the digestion: ~850 bp for the Insert (BBa_J23107+BBa_F1610) and ~2070 bp for the vector ) |
File links
The following page links to this file: