Team:PennState/diauxie/progress
From 2008.igem.org
| Line 284: | Line 284: | ||
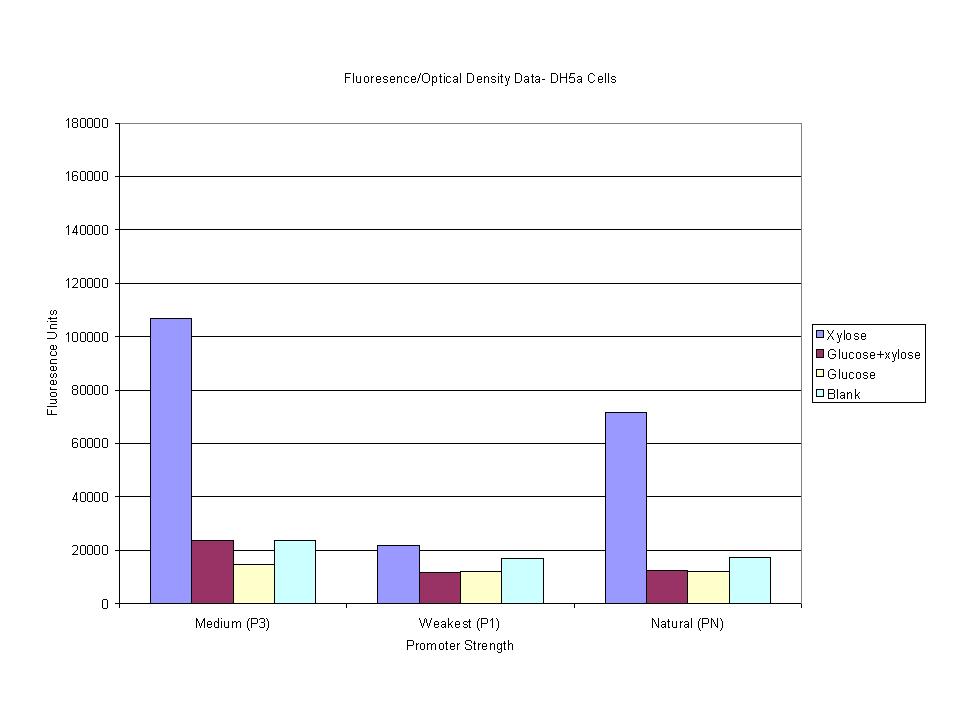
<p>These graphs show the normalized fluoresence strength for PN, P1, and P3 xylose promoters induced with xylose, glucose, and a mixture. The W3110 cells have <em>xylE</em> and <em>xylG</em> knocked out while DH5α still contain the natural xylose transport and metabolim. This data shows that there is little effect on the fluorescence intensity using strains with <em>xylE</em> and <em>xylG</em> sequences deleted. Our next step is to transform these promoters into <em>E. coli</em> cells with deleted xylose metabolism and transporters. </p> | <p>These graphs show the normalized fluoresence strength for PN, P1, and P3 xylose promoters induced with xylose, glucose, and a mixture. The W3110 cells have <em>xylE</em> and <em>xylG</em> knocked out while DH5α still contain the natural xylose transport and metabolim. This data shows that there is little effect on the fluorescence intensity using strains with <em>xylE</em> and <em>xylG</em> sequences deleted. Our next step is to transform these promoters into <em>E. coli</em> cells with deleted xylose metabolism and transporters. </p> | ||
| + | |||
| + | <table> <!-- this table separates content into column-like quadrants --> | ||
| + | <tr> | ||
| + | <td style="padding-top:30px; padding-right:30px" valign="top" width="33%"><h4>"Smart Fold" Pthalate Biosensor</h4> | ||
| + | <hr /> | ||
| + | </div> | ||
| + | <div id="psugallery" style="float: right; clear: right; width: 500px;"> | ||
| + | <div class="gallerybox" style="width: 155px; float: left; clear: none;"> | ||
| + | <div class="thumb" style="padding: 18px 0pt; width: 150px;"><div style="margin: auto; width: 120px;"><a href="/Image:PN_time_penn_state_08.jpg" class="image" title="PN_time_penn_state_08.jpg"><img alt="" src="/wiki/images/2/29/PN_time_penn_state_08.jpg" border="0" height="110" width="120"></a></div></div> | ||
| + | <div class="gallerytext"><p>PN induction time</p></div> | ||
| + | </div> | ||
| + | |||
| + | |||
| + | </td> | ||
| + | |||
| + | <td style="padding-top:30px; padding-right:30px" valign="top" width="33%"><h4>"Nuclear Fusion" BPA Biosensor</h4> | ||
| + | <hr /> | ||
| + | </div> | ||
| + | <div id="psugallery" style="float: right; clear: right; width: 500px;"> | ||
| + | <div class="gallerybox" style="width: 155px; float: left; clear: none;"> | ||
| + | <div class="thumb" style="padding: 18px 0pt; width: 150px;"><div style="margin: auto; width: 120px;"><a href="/Image:P1_time_penn_state08.jpg" class="image" title="P1_time_penn_state08.jpg"><img alt="" src="/wiki/images/8/8d/P1_time_penn_state08.jpg" border="0" height="110" width="120"></a></div></div> | ||
| + | <div class="gallerytext"><p>P1 induction time</p></div> | ||
| + | </div> | ||
| + | |||
| + | </td> | ||
| + | |||
| + | <td style="padding-top:30px; padding-right:30px" valign="top" width="33%"><h4>"Nuclear Fusion" BPA Biosensor</h4> | ||
| + | <hr /> | ||
| + | </div> | ||
| + | <div id="psugallery" style="float: right; clear: right; width: 500px;"> | ||
| + | <div class="gallerybox" style="width: 155px; float: left; clear: none;"> | ||
| + | <div class="thumb" style="padding: 18px 0pt; width: 150px;"><div style="margin: auto; width: 120px;"><a href="/Image:P3_time_penn_state08.jpg" class="image" title="P3_time_penn_state08.jpg"><img alt="" src="/wiki/images/7/75/P3_time_penn_state08.jpg" border="0" height="110" width="120"></a></div></div> | ||
| + | <div class="gallerytext"><p>P3 induction time</p></div> | ||
| + | </div> | ||
| + | </td> | ||
| + | |||
| + | </p></td> | ||
| + | </tr> | ||
| + | </table> | ||
| + | |||
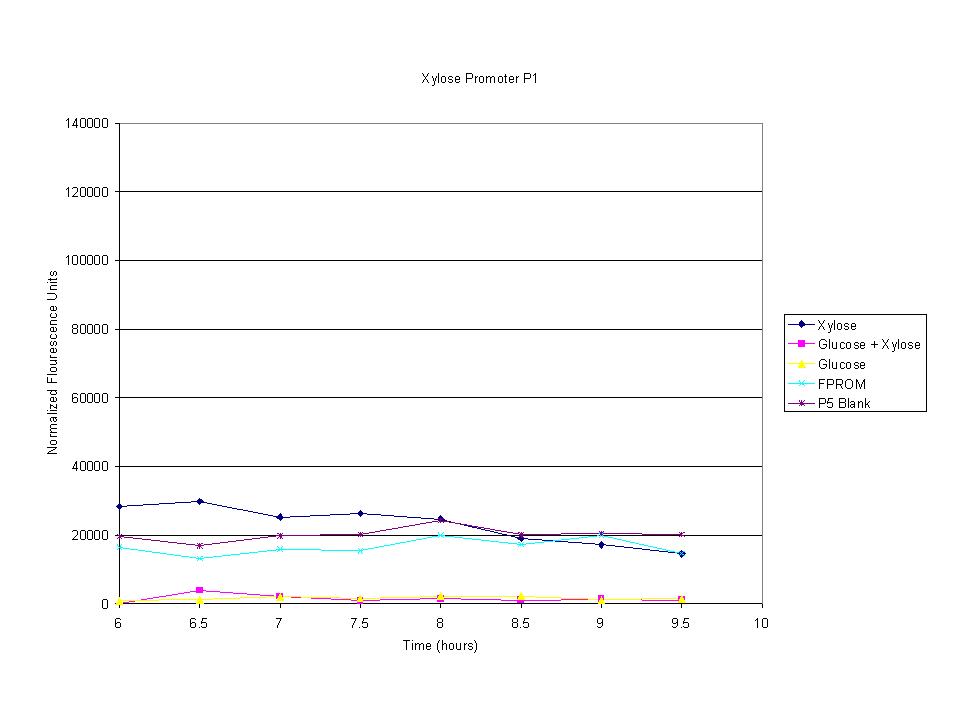
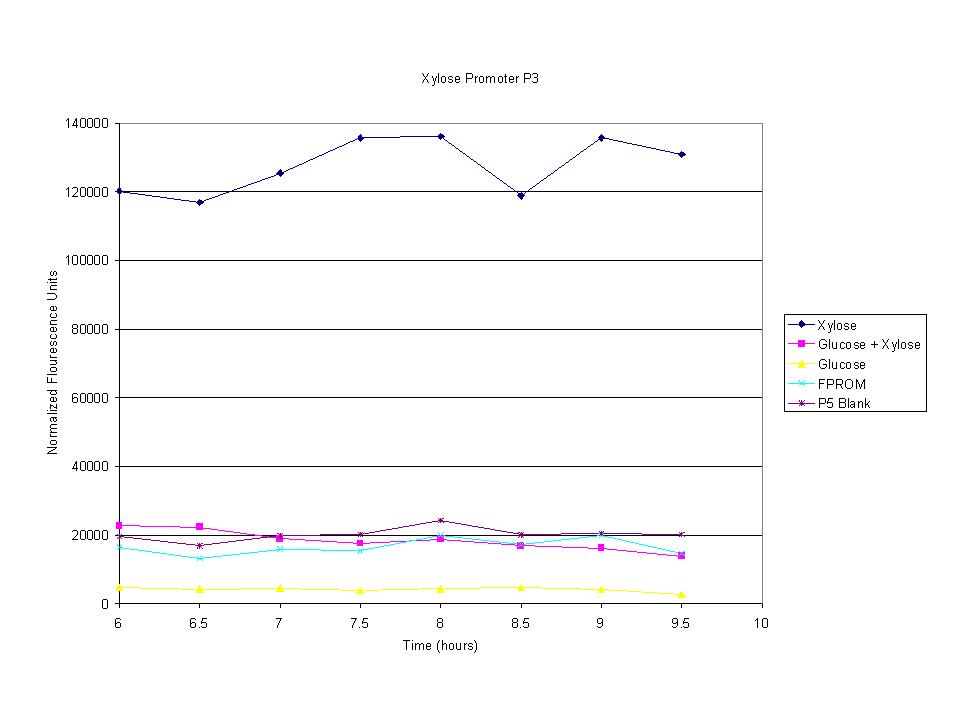
| + | <p>The cells were induced iduced with sugars and then allowed to grow with sample being removed every half hour. The goal was to find the induction time where fluorescence starts to level off. The intensity has leveled off and begins to drop after 7.5 hours so this was the growth time for all future tests. | ||
| + | </p> | ||
| + | |||
| + | |||
| + | |||
| + | |||
| + | |||
| + | |||
Revision as of 01:46, 30 October 2008

| Home | The Team | The Project | Parts | Notebook |
Diauxie EliminationNHR Biosensors
|
Progress & Results
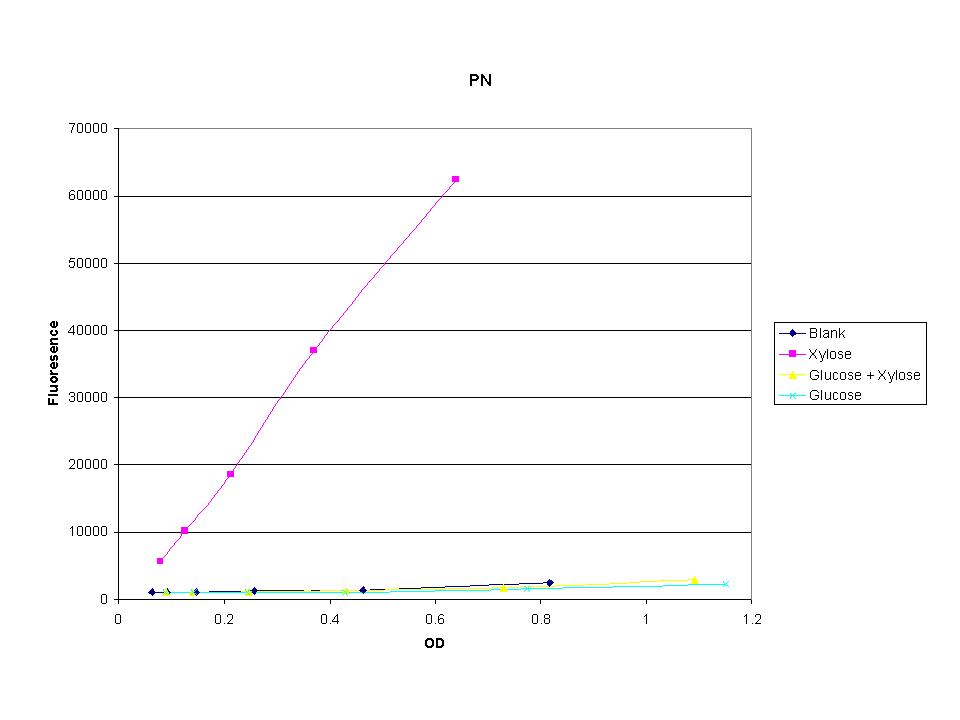
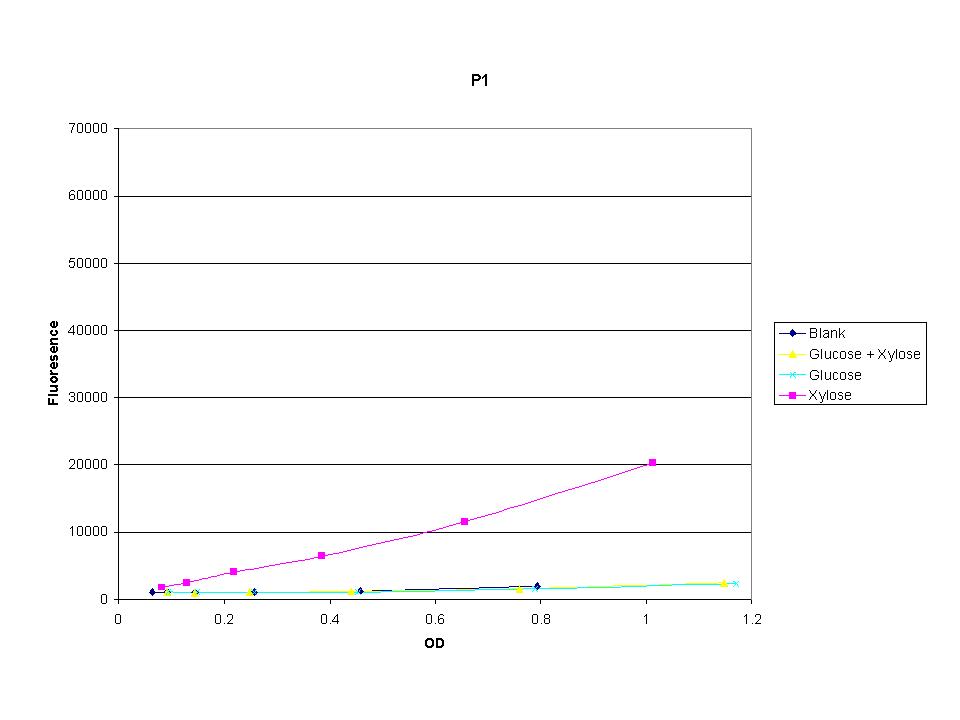
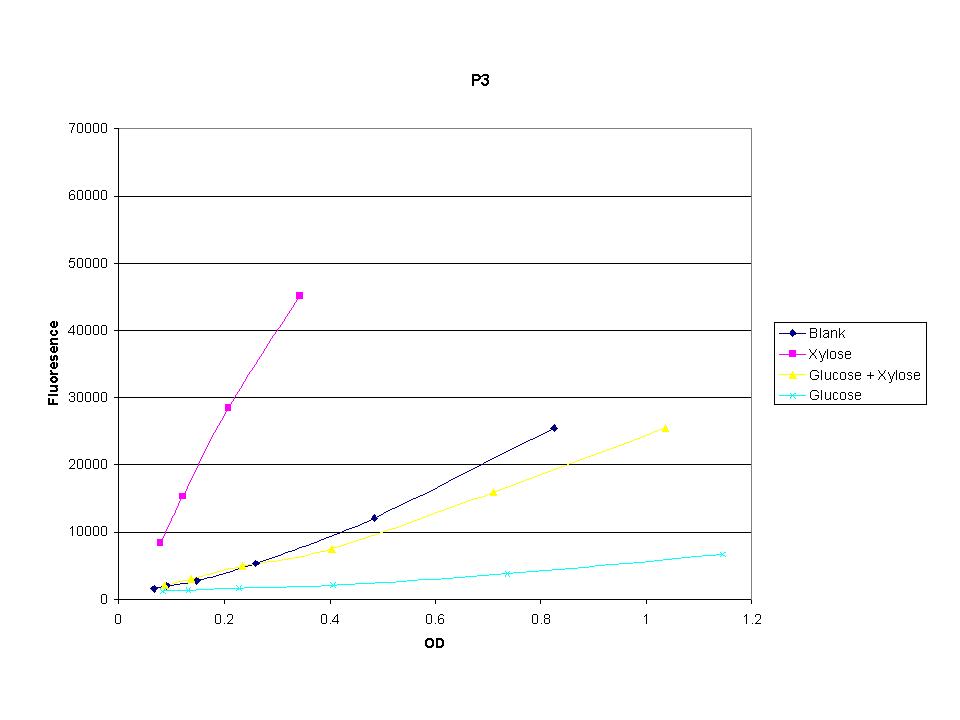
Each test construct (promoter + GFP) was cloned into the pSB1A2 plasmid and transformed into several E. coli strains: DH5α, W3110 ∆xylB-G, and W3110 ∆xylB-R. Preliminary induction studies were run to find the optimal induction time and to analyze the linear range for OD versus fluorescence. Test Construct![[Test Consturct]](https://static.igem.org/mediawiki/2008/1/1b/Test_construct.JPG)
These graphs show the normalized fluoresence strength for PN, P1, and P3 xylose promoters induced with xylose, glucose, and a mixture. The W3110 cells have xylE and xylG knocked out while DH5α still contain the natural xylose transport and metabolim. This data shows that there is little effect on the fluorescence intensity using strains with xylE and xylG sequences deleted. Our next step is to transform these promoters into E. coli cells with deleted xylose metabolism and transporters.
The cells were induced iduced with sugars and then allowed to grow with sample being removed every half hour. The goal was to find the induction time where fluorescence starts to level off. The intensity has leveled off and begins to drop after 7.5 hours so this was the growth time for all future tests. |
 "
"
