Team:Edinburgh/Results/Glycogen3
From 2008.igem.org
| (17 intermediate revisions not shown) | |||
| Line 1: | Line 1: | ||
<div id="header">{{Template:Team:Edinburgh/Templates/Header}}</div> | <div id="header">{{Template:Team:Edinburgh/Templates/Header}}</div> | ||
| - | '''[[Team:Edinburgh/Results/Glycogen2|< Previous | + | '''[[Team:Edinburgh/Results/Glycogen2|< Previous Assay]] | [[Team:Edinburgh/Results|Back to Results]] | [[Team:Edinburgh/Results/Glycogen4|Next Assay >]]''' |
| - | == Glycogen Assay 3 (Quantitative) == | + | == Glycogen Assay 3 (Quantitative: Raman Spectroscopy) == |
| + | |||
| + | Raman spectroscopy was performed by '''Dr Rabah Mouras''', School of Engineering & Electronics, University of Edinburgh. | ||
=== Experiment Design === | === Experiment Design === | ||
| - | This | + | This experiment was designed to test whether Raman spectroscopy could be used to determine glycogen levels. Samples used were those which had shown various levels of glycogen in the iodine assay: |
* '''Sample 1 (Control):''' ''E. coli'' cells with no modification to the glycogen production system and grown in a medium which does not promote glycogen formation. These should have a low, basal level of glycogen. | * '''Sample 1 (Control):''' ''E. coli'' cells with no modification to the glycogen production system and grown in a medium which does not promote glycogen formation. These should have a low, basal level of glycogen. | ||
| - | * '''Sample 2:''' ''E. coli'' cells | + | * '''Sample 2:''' ''E. coli'' cells overexpressing ''glgC16'' BioBrick<sup>TM</sup> and grown in a glucose-free medium. These should produce a higher level of glycogen than the control. |
| - | * '''Sample 3:''' ''E. coli'' cells | + | * '''Sample 3:''' ''E. coli'' cells overexpressing with the ''glgC16'' Biobrick<sup>TM</sup> and grown in a high-glucose medium. These should produce the highest level of glycogen. |
Results from [[Team:Edinburgh/Results/Glycogen2|Glycogen Assay 2 (Qualitative)]] were in line with these expectations. | Results from [[Team:Edinburgh/Results/Glycogen2|Glycogen Assay 2 (Qualitative)]] were in line with these expectations. | ||
| - | + | Cells from the three samples were harvested by centrifugation and killed by suspension in 1/10 volume of ethanol (a requirement before GM organisms could be removed from the biological laboratory for analysis) and then analysed by Raman spectroscopy to determine the glycogen:protein ratio. Glycogen results in a peak at a Raman shift of 478cm<sup>-1</sup>, so the Raman intensity of this peak was measured for each sample and compared to the Phenylalanine peak at 1003cm<sup>-1</sup>. | |
=== Results === | === Results === | ||
| Line 20: | Line 22: | ||
[[Image:Edinburgh%3DGlycogen-Assay3.jpg|500px]] | [[Image:Edinburgh%3DGlycogen-Assay3.jpg|500px]] | ||
| - | The results confirm our expectations. | + | The results confirm our expectations. Control cells (S1) produced the least amount of glycogen and cells overexpressing ''glgC16'' and grown in high-glucose medium (S3), the most. From the intensity of the glycogen peak, the concentration of glycogen in S3 is estimated to be 3~4 times more than in S2. |
| - | We may thus conclude that the ''glgC16'' BioBrick results in significantly increased production of glycogen, especially in a high-glucose medium. | + | We may thus conclude that the ''glgC16'' BioBrick<sup>TM</sup> results in significantly increased production of glycogen, especially in a high-glucose medium, as previously determined by the iodine assay. This shows that Raman spectroscopy can be used to measure glycogen levels. |
Latest revision as of 02:02, 30 October 2008
< Previous Assay | Back to Results | Next Assay >
Glycogen Assay 3 (Quantitative: Raman Spectroscopy)
Raman spectroscopy was performed by Dr Rabah Mouras, School of Engineering & Electronics, University of Edinburgh.
Experiment Design
This experiment was designed to test whether Raman spectroscopy could be used to determine glycogen levels. Samples used were those which had shown various levels of glycogen in the iodine assay:
- Sample 1 (Control): E. coli cells with no modification to the glycogen production system and grown in a medium which does not promote glycogen formation. These should have a low, basal level of glycogen.
- Sample 2: E. coli cells overexpressing glgC16 BioBrickTM and grown in a glucose-free medium. These should produce a higher level of glycogen than the control.
- Sample 3: E. coli cells overexpressing with the glgC16 BiobrickTM and grown in a high-glucose medium. These should produce the highest level of glycogen.
Results from Glycogen Assay 2 (Qualitative) were in line with these expectations.
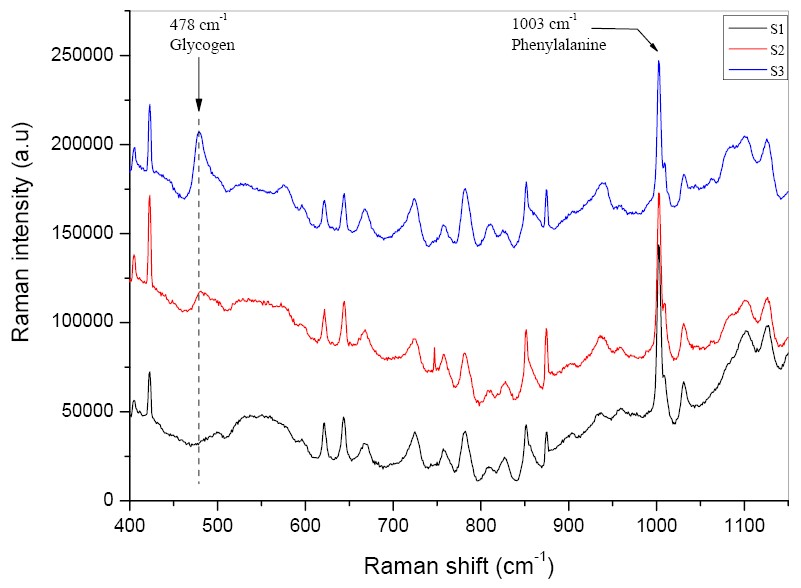
Cells from the three samples were harvested by centrifugation and killed by suspension in 1/10 volume of ethanol (a requirement before GM organisms could be removed from the biological laboratory for analysis) and then analysed by Raman spectroscopy to determine the glycogen:protein ratio. Glycogen results in a peak at a Raman shift of 478cm-1, so the Raman intensity of this peak was measured for each sample and compared to the Phenylalanine peak at 1003cm-1.
Results
The results confirm our expectations. Control cells (S1) produced the least amount of glycogen and cells overexpressing glgC16 and grown in high-glucose medium (S3), the most. From the intensity of the glycogen peak, the concentration of glycogen in S3 is estimated to be 3~4 times more than in S2.
We may thus conclude that the glgC16 BioBrickTM results in significantly increased production of glycogen, especially in a high-glucose medium, as previously determined by the iodine assay. This shows that Raman spectroscopy can be used to measure glycogen levels.
 "
"

