Team:Imperial College/Genetic Circuit Details
From 2008.igem.org
m |
|||
| (39 intermediate revisions not shown) | |||
| Line 1: | Line 1: | ||
{{Imperial/StartPage2}} | {{Imperial/StartPage2}} | ||
| - | {{Imperial/Box1|Simple Model ({{ref|1}}) | | + | {{Imperial/Box1|Simple Model ({{ref|1}})| |
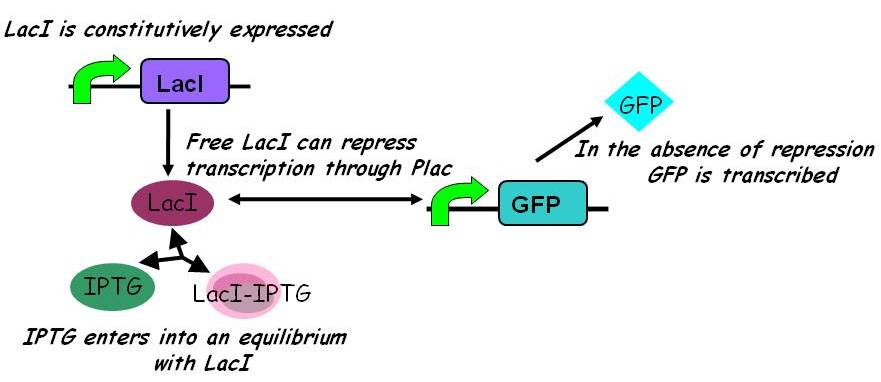
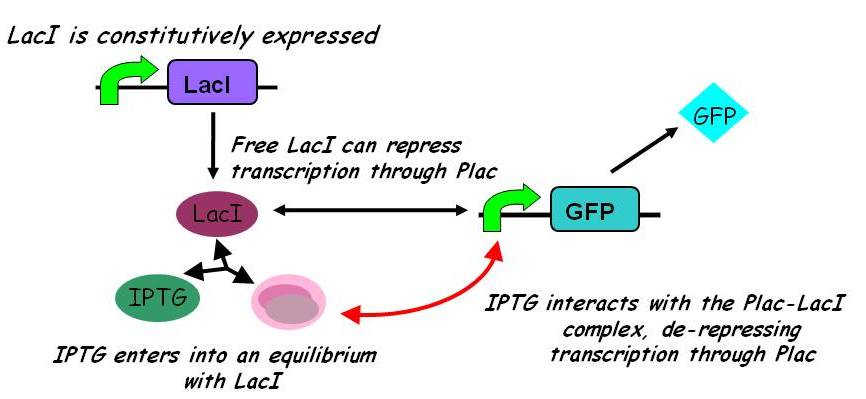
| + | [[Image:Igem2008_-_inducible_promoters.jpg|450px]] | ||
| + | ====== Equilibria ====== | ||
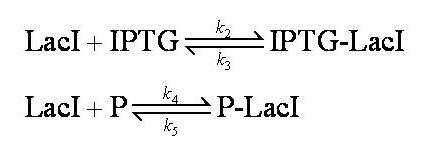
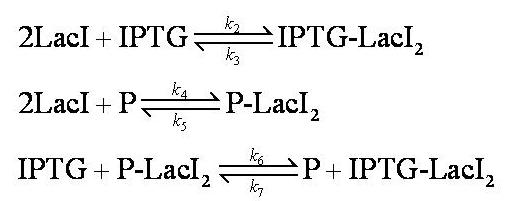
| + | Interactions between IPTG, LacI and free promoter and the formation of the promoter-LacI and IPTG-LacI complexes are described using the following equilibria. | ||
| + | [[Image:Simple_model_equilibria.jpg|350px]] | ||
| + | |||
| + | Note: 1:1 stoichiometry has been assumed; this model could be adapted to use different stoichiometric coefficients. | ||
| + | |||
| + | k<sub>2</sub>, k<sub>3</sub>, k<sub>4</sub> and k<sub>5</sub> represent binding constants for formation and dissociation of complexes. | ||
| + | ====== Equations ====== | ||
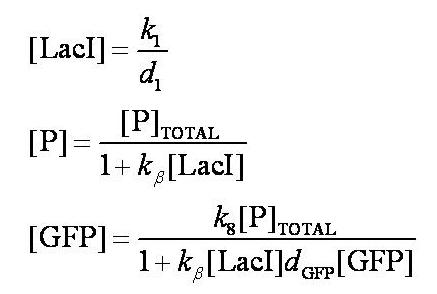
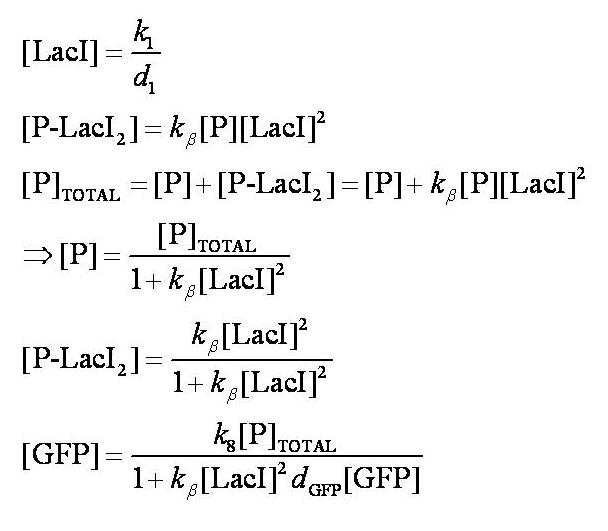
| + | Before IPTG is introduced the system is at steady-state. The steady-state levels of LacI, free promoter, and GFP are given by: | ||
| + | |||
| + | [[Image:Simple_model_steady_state_pre_induction.jpg|300px]] | ||
| + | |||
| + | Note: k<sub>1</sub> and k<sub>8</sub> represent the rate of transcription through the constitutive promoter upstream of LacI and the promoter upstream of GFP respectively. | ||
| + | |||
| + | d<sub>1</sub> and d<sub>GFP</sub> represent the degradation rates of LacI and GFP respectively. | ||
| + | |||
| + | k<sub>ß</sub> is defined as k<sub>4</sub>/k<sub>5</sub>. | ||
| + | |||
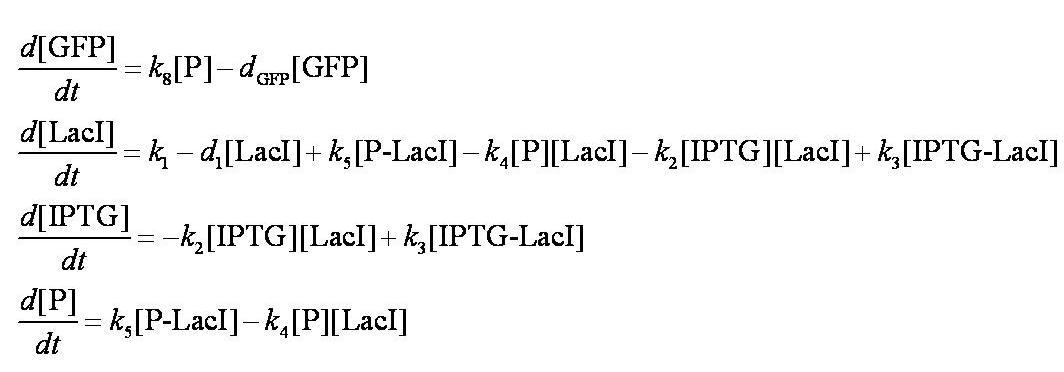
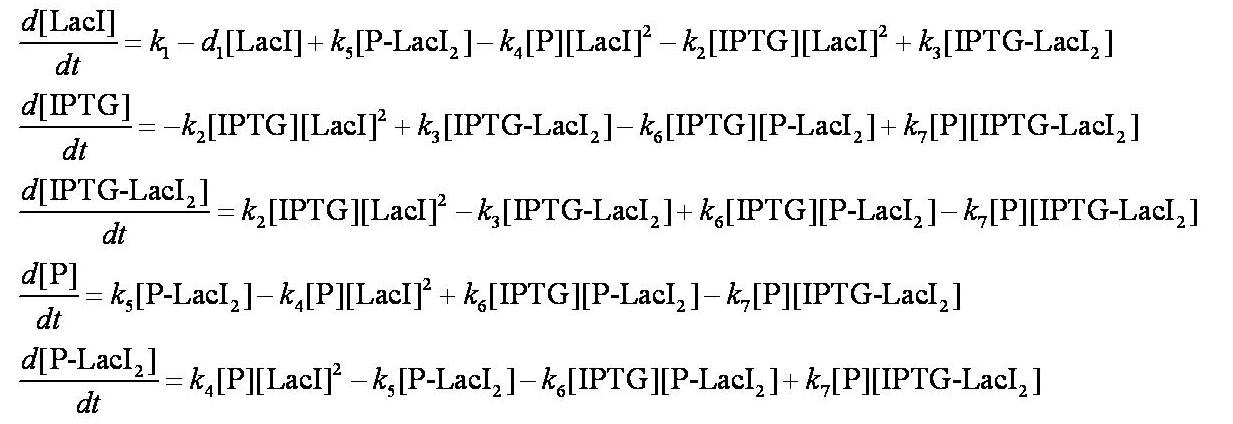
| + | To describe the change in concentration of the interacting species over time we used the following system of differential equations: | ||
| + | |||
| + | [[Image:Simple_model_ODEs.jpg|700px]] | ||
| + | |||
| + | These are evaluated numerically using Matlab's ODE solver. | ||
| + | |||
| + | Note from the differential equations above that the steady-state concentration of free promoter will be independent of the concentration of IPTG introduced into the system. The pre-steady-state maximum concentrotion of GFP attained will differ, however - this is illustrated on the [[Team:Imperial_College/Genetic_Circuit | Genetic Circuit]] page and can be explored further using the [[Media:InduciblePromoterSimple.m|simulations]]. | ||
}} | }} | ||
| - | {{Imperial/Box1|More Sophisticated Model ({{ref|2}}) | | + | {{Imperial/Box1|More Sophisticated Model ({{ref|2}})| |
| - | =====Equilibria===== | + | [[Image:Inducible_promoters_2.jpg|450px]] |
| - | + | ====== Equilibria ====== | |
| + | [[Image:Complex_model_equilibria.jpg|350px]] | ||
| + | |||
| + | Assumptions: | ||
| + | |||
| + | No intermediary P-IPTG-LacI complex is formed. | ||
| + | |||
| + | We assumed 2 LacI molecules bind to the promoter, in accordance with the model description ({{ref|2}}). | ||
| + | |||
| + | Note: k<sub>2</sub>, k<sub>3</sub>, k<sub>4</sub>, k<sub>5</sub>, k<sub>6</sub> and k<sub>7</sub> represent binding constants for formation and dissociation of complexes. | ||
| + | |||
| + | ====== Equations ====== | ||
| + | |||
| + | Before IPTG is introduced the system is in a steady state: | ||
| + | |||
| + | [[Image:Pre_IPTG_Steady_States_Complex_Model.jpg|400px]] | ||
| + | |||
| + | Note: k<sub>1</sub> and k<sub>8</sub> represent the rate of transcription through the constitutive promoter upstream of LacI and the promoter upstream of GFP respectively. | ||
| + | |||
| + | d<sub>1</sub> and d<sub>GFP</sub> represent the degradation rates of LacI and GFP respectively. | ||
| + | |||
| + | k<sub>ß</sub> is defined as k<sub>4</sub>/k<sub>5</sub>. | ||
| + | |||
| + | When IPTG is introduced, the dynamic behaviour of the system is described using a system of ODEs. | ||
| + | |||
| + | [[Image:Complex_Model_ODEs.jpg|750px]] | ||
| + | |||
| + | These are evaluated numerically using Matlab's ODE solver. | ||
| + | |||
| + | ====== Qualitative effect of parameters on behaviour ====== | ||
| + | |||
| + | Two different regimes of behaviour can be exhibited by the concentration of GFP over time as described by the more complex model, dependent on the parameters defining the ODE system. | ||
| + | |||
| + | Either the concentration of GFP increases up to a steady-state value, or it displays a hump, increasing to a maximum before returning to a lower steady-state level. This latter case is illustrated on the [[Team:Imperial_College/Genetic_Circuit | Genetic Circuit]] page but both cases can be explored using the [[Media:InduciblePromoter.m|simulations]]. The two regimes of behaviour are parameter-dependent and depend on the relative strengths of repression by LacI biding to the promoter and de-repression due to the interaction of IPTG with the Promoter-LacI complex. | ||
| + | |||
| + | It can be shown that the larger the ratio of relative strengths of de-repression and repression, the larger the gain in fluorescence before the steady state is reached. | ||
| + | |||
}} | }} | ||
{{Imperial/Box2|| | {{Imperial/Box2|| | ||
===== References ===== | ===== References ===== | ||
| - | |||
#{{FormatRef|Alon, U|2006|An Introduction to Systems Biology: Design Principles of Biological Circuits|||Chapman & Hall/Crc Mathematical and Computational Biology}} | #{{FormatRef|Alon, U|2006|An Introduction to Systems Biology: Design Principles of Biological Circuits|||Chapman & Hall/Crc Mathematical and Computational Biology}} | ||
| + | #{{FormatRef|Kuhlman T, Zhang Z, Saier MH Jr, & Hwa T|2007|Combinatorial transcriptional control of the lactose operon of Escherichia coli.|PNAS 104 (14)|6043-6048|}} | ||
|}} | |}} | ||
| - | {{Imperial/EndPage| | + | {{Imperial/EndPage|Genetic_Circuit|Genetic_Circuit}} |
Latest revision as of 02:50, 30 October 2008
|
|||||||||||||||
 "
"

