Team:NTU-Singapore/Parts/Characterization of LacI-GFP
From 2008.igem.org
Lalala8585 (Talk | contribs) |
(→Characterization of LacI-GFP) |
||
| Line 16: | Line 16: | ||
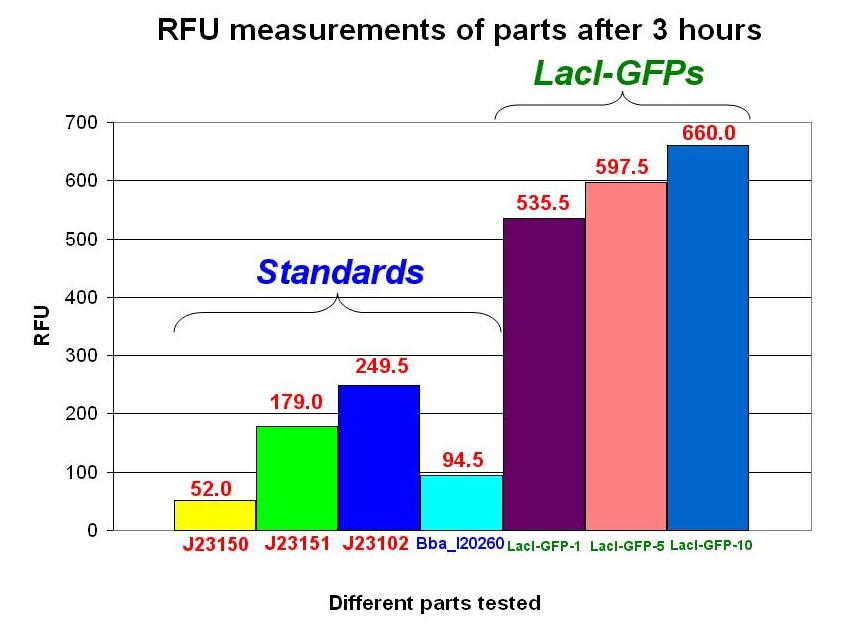
===In comparision with the Standards=== | ===In comparision with the Standards=== | ||
| - | [[Image:NTU_Characterization_Graph_standards_&_LacI_GFPs_(3_hours).JPG|thumb|center|700px|Characterization Graph of | + | [[Image:NTU_Characterization_Graph_standards_&_LacI_GFPs_(3_hours).JPG|thumb|center|700px|Characterization Graph of Standards & LacI-GFP after 3 hours]] |
==RFU Measurements After 3.5 hours== | ==RFU Measurements After 3.5 hours== | ||
| Line 25: | Line 25: | ||
===In comparision with the Standards=== | ===In comparision with the Standards=== | ||
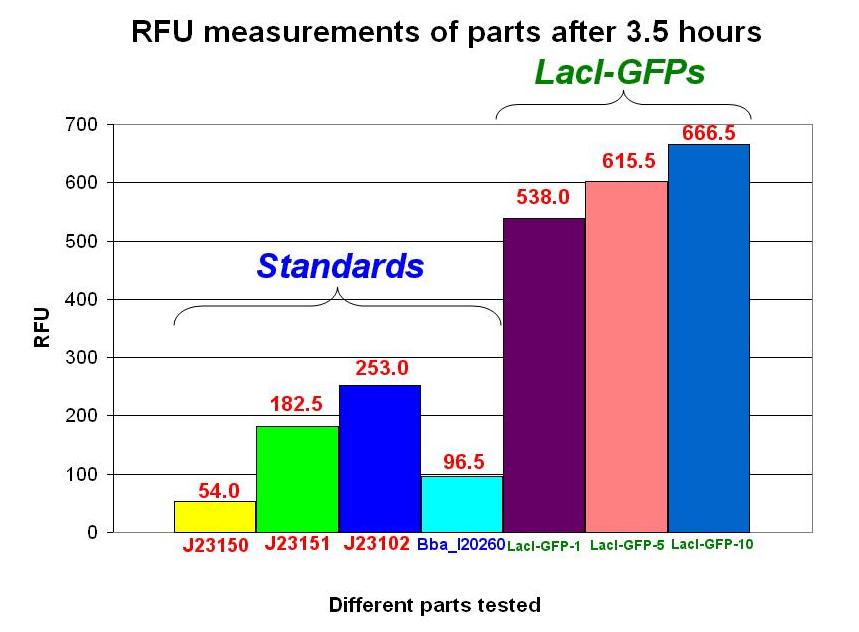
| - | [[Image:NTU_Characterization_Graph_standards_&_LacI_GFPs_(3.5_hours).JPG|thumb|center|700px|Characterization Graph of | + | [[Image:NTU_Characterization_Graph_standards_&_LacI_GFPs_(3.5_hours).JPG|thumb|center|700px|Characterization Graph of Standards & LacI-GFP after 3.5 hours]] |
| + | |||
| + | |||
| + | ==Quantifying the concentration of Protein formed== | ||
| + | |||
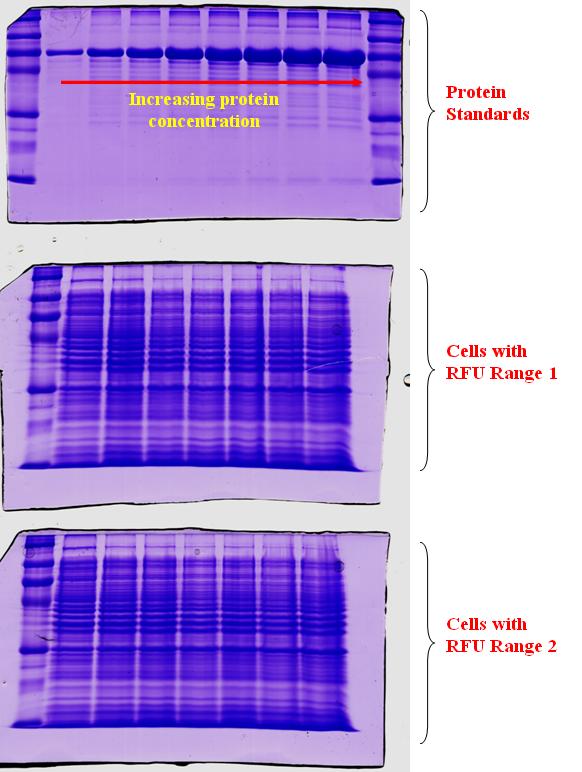
| + | In an attempt to quantify the concentration of GFP protein formed relative to the RFU measurements, we took cell samples of varying RFU values and store the cells in minus 20 deg till a corresponding range of RFU values were collected. After which, varying protein standards of known concentration were prepared and a gel was conducted as depicted in the top gel run. As shown in the gel run, with an increasing protein concentration, the thickness of the band will also increase. The next two gel runs in the diagram are for the range of RFU investigated. At higher RFU readings, we would expect a higher protein concentration present. Hence, a thicker band should also be seen. However, for the increasing range of RFU readings, we do not obtain an expected increase in thickness of the band. | ||
| + | |||
| + | This could be due to the following reasons | ||
| + | 1) The increase in RFU was because of the increase in cell number and not the increase in concentration of the GFP protein. | ||
| + | 2) The increase in band thickness was not distinctive, as the concentration GFP protein when compared to the other proteins in the cell may be low. | ||
| + | |||
| + | [[Image:NTU_Characterization_RFU_GEL_run.JPG|thumb|center|700px|Characterization RFU GEL Run]] | ||
Revision as of 15:55, 2 September 2008
|
Contents |
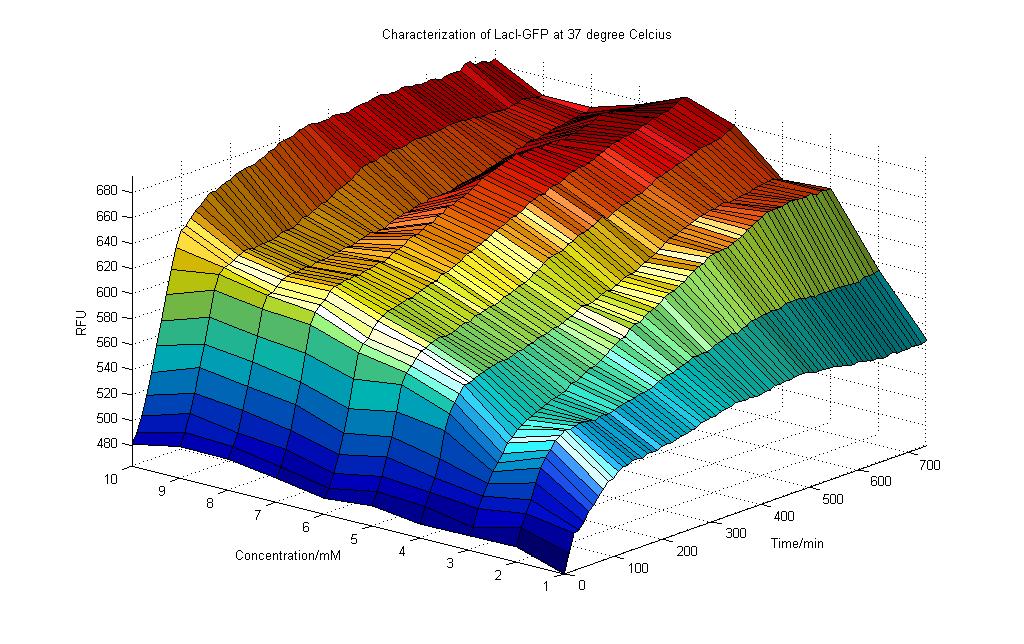
Characterization of LacI-GFP
Results obtained at 37 degree Celcius
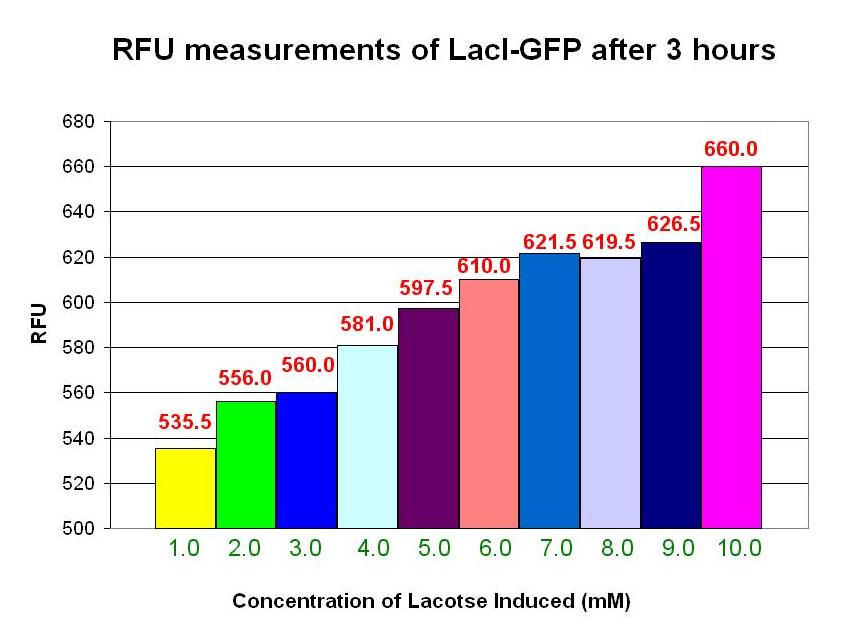
RFU Measurements After 3 hours
For Lactose induction of 0 to 10 mM
In comparision with the Standards
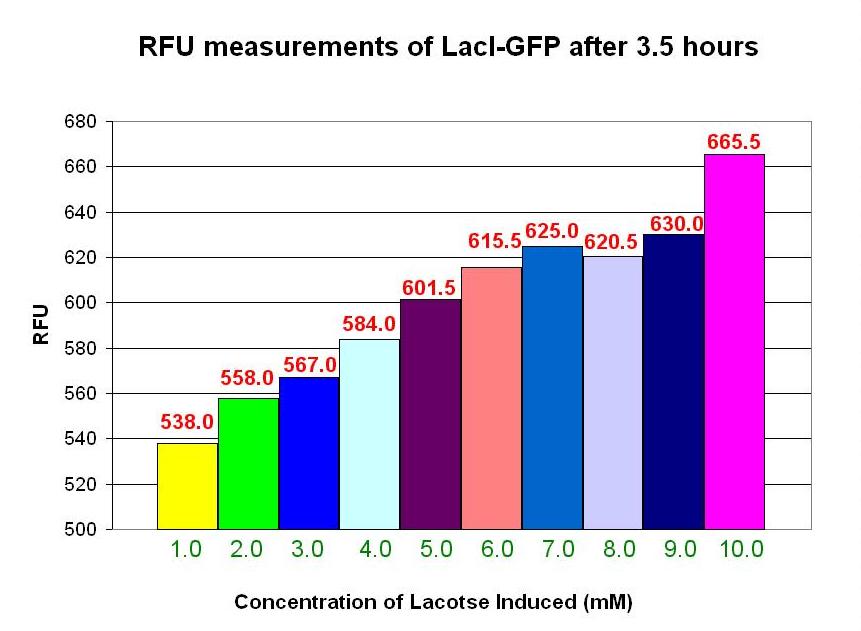
RFU Measurements After 3.5 hours
For Lactose induction of 0 to 10 mM
In comparision with the Standards
Quantifying the concentration of Protein formed
In an attempt to quantify the concentration of GFP protein formed relative to the RFU measurements, we took cell samples of varying RFU values and store the cells in minus 20 deg till a corresponding range of RFU values were collected. After which, varying protein standards of known concentration were prepared and a gel was conducted as depicted in the top gel run. As shown in the gel run, with an increasing protein concentration, the thickness of the band will also increase. The next two gel runs in the diagram are for the range of RFU investigated. At higher RFU readings, we would expect a higher protein concentration present. Hence, a thicker band should also be seen. However, for the increasing range of RFU readings, we do not obtain an expected increase in thickness of the band.
This could be due to the following reasons 1) The increase in RFU was because of the increase in cell number and not the increase in concentration of the GFP protein. 2) The increase in band thickness was not distinctive, as the concentration GFP protein when compared to the other proteins in the cell may be low.
 "
"

