Purdue/10 June 2008
From 2008.igem.org
| Line 9: | Line 9: | ||
In an effort to determine which fits are the "best", more data will be collected and analyzed with the predictions from the charts. No extrapolated data will be used, only the time points within the range will be used. | In an effort to determine which fits are the "best", more data will be collected and analyzed with the predictions from the charts. No extrapolated data will be used, only the time points within the range will be used. | ||
| + | |||
| + | |||
| + | [[Image:Mathcad_Set 2_Data_1.jpg]] | ||
| + | |||
| + | This fit is not ideal due the the concavity at the end of the run. More data points to improve the model would theoretically alleviate this problem. The Columns at the top right show the mathematical models. | ||
| + | |||
| + | [[Image:Mathcad_Set 2_Data_2.jpg]] | ||
| + | |||
| + | This is the best polynomial fit. The slight bump at the beginning of the run is not ideal, since the pH does not rise, but this model fits with the "ideal" situation of lag/exponential. | ||
| + | |||
| + | [[Image:Mathcad_Set 2_Data_3.jpg]] | ||
| + | |||
| + | This fit is the same as one in terms of ideality. | ||
| + | |||
| + | [[Image:Excel Chart_Set 2_Linear_EXP.jpg]] | ||
| + | |||
| + | This is a series fit that uses a linear fit at the lag stage (the R-squared value is very low due to the fact that all three data sets showed variability from one another) and an exponential during the exponential stages.\ | ||
| + | |||
| + | [[Image:Excel Chart_Set 2_Cubic.jpg]] | ||
| + | |||
| + | This is a 3rd order polynomial fit to all of the data lumped together. It is a decent fit that is possibly "better" than the individual in that it accounts for the variability within the model. | ||
Revision as of 19:45, 10 June 2008
Click Here to return to the notebook.
Streaked plate with Qbiogene SuperGloGFP (strain of E. coli containing the plasmid pQBlT7-GFP) for later use in testing of Sol-Gel "Bio Window".
Edited by Janie Stine
Below are 5 graphs that have various fits, either 3rd order polynomial, or a series of fits with linear and exponential fits.
In an effort to determine which fits are the "best", more data will be collected and analyzed with the predictions from the charts. No extrapolated data will be used, only the time points within the range will be used.
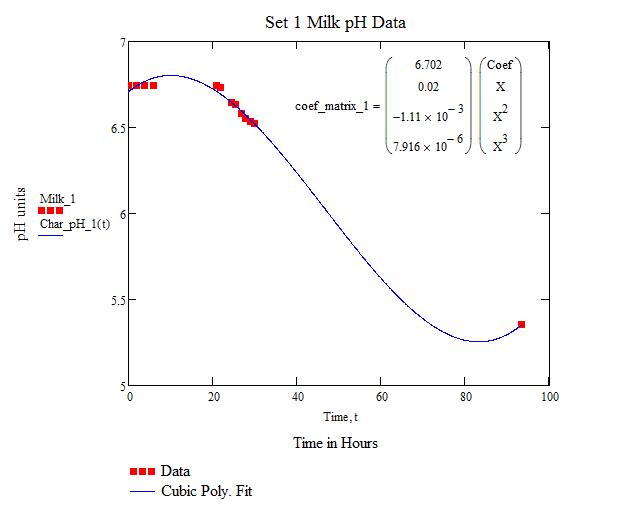
This fit is not ideal due the the concavity at the end of the run. More data points to improve the model would theoretically alleviate this problem. The Columns at the top right show the mathematical models.
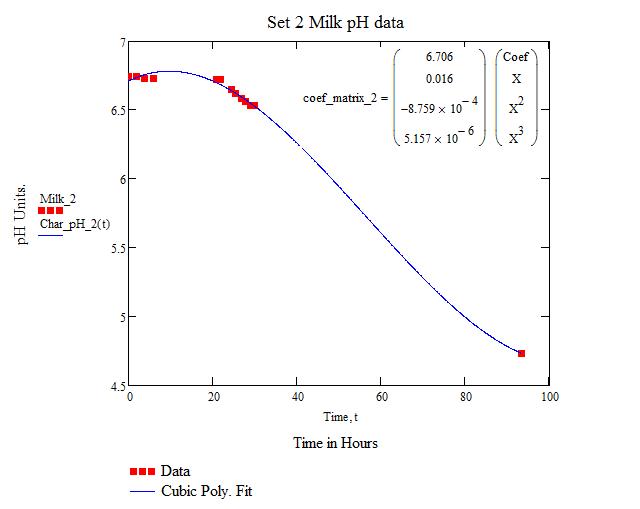
This is the best polynomial fit. The slight bump at the beginning of the run is not ideal, since the pH does not rise, but this model fits with the "ideal" situation of lag/exponential.
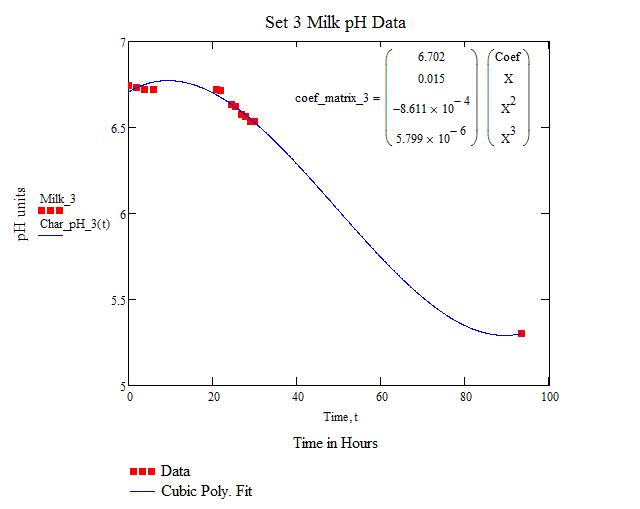
This fit is the same as one in terms of ideality.
This is a series fit that uses a linear fit at the lag stage (the R-squared value is very low due to the fact that all three data sets showed variability from one another) and an exponential during the exponential stages.\
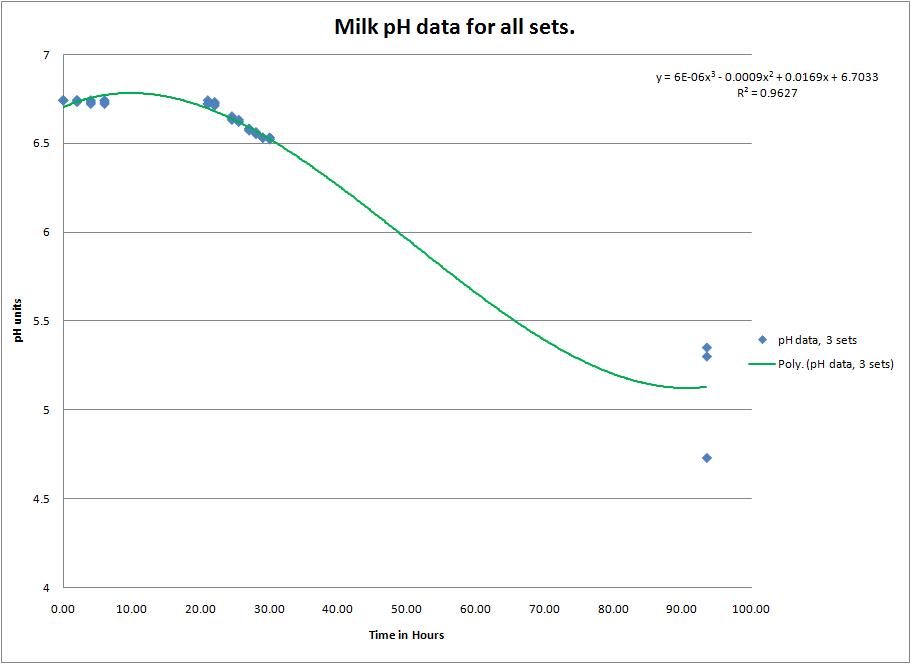
This is a 3rd order polynomial fit to all of the data lumped together. It is a decent fit that is possibly "better" than the individual in that it accounts for the variability within the model.
 "
"


