|
|
| Line 41: |
Line 41: |
| | |'''Error in Y Coordinate''' | | |'''Error in Y Coordinate''' |
| | |- | | |- |
| - | |[[Image:Multiple Error X.jpg|300px]] | + | |[[Image:Multiple Error X.JPG|300px]] |
| - | |[[Image:Multiple Error Y px.jpg|300px]] | + | |[[Image:Multiple Error Y px.JPG|300px]] |
| | |- | | |- |
| | |Mean = 1.7354, Standard Deviation = 1.7187 | | |Mean = 1.7354, Standard Deviation = 1.7187 |
| Line 51: |
Line 51: |
| | |'''Error in Distance''' | | |'''Error in Distance''' |
| | |- | | |- |
| - | |[[Image:Multiple Error X Displacement.jpg|300px]] | + | |[[Image:Multiple Error X Displacement.JPG|300px]] |
| - | |[[Image:Multiple Error Y Displacement.jpg|300px]] | + | |[[Image:Multiple Error Y Displacement.JPG|300px]] |
| - | |[[Image:Multiple_Error_Distance.jpg|300px]] | + | |[[Image:Multiple_Error_Distance.JPG|300px]] |
| | |- | | |- |
| | |Mean = -0.0022, Standard Deviation = 1.0002 | | |Mean = -0.0022, Standard Deviation = 1.0002 |
| Line 68: |
Line 68: |
| | |'''Error in Y Coordinate''' | | |'''Error in Y Coordinate''' |
| | |- | | |- |
| - | |[[Image:Volocity X Error.jpg|300px]] | + | |[[Image:Volocity X Error.JPG|300px]] |
| - | |[[Image:Volocity Y Error.jpg|300px]] | + | |[[Image:Volocity Y Error.JPG|300px]] |
| | |- | | |- |
| | |Mean = -1.7149, Standard Deviation = 0.1376 | | |Mean = -1.7149, Standard Deviation = 0.1376 |
| Line 78: |
Line 78: |
| | |'''Error in Distance''' | | |'''Error in Distance''' |
| | |- | | |- |
| - | |[[Image:Volocity X Displacement Error.jpg|300px]] | + | |[[Image:Volocity X Displacement Error.JPG|300px]] |
| - | |[[Image:Volocity Y Displacement Error.jpg|300px]] | + | |[[Image:Volocity Y Displacement Error.JPG|300px]] |
| - | |[[Image:Volocity Distance Error.jpg|300px]] | + | |[[Image:Volocity Distance Error.JPG|300px]] |
| | |- | | |- |
| | |Mean = 8.2732e-005, Standard Deviation = 0.1111 | | |Mean = 8.2732e-005, Standard Deviation = 0.1111 |
|
Validating Tracking Software
ImageJ was used primarily to analyse images. Various plugins were tested, such as SpotTracker and Particle Tracker, but both failed to producing any form of convincing result. Microscopy videos were captured using Volocity software, which also provided a cell tracking function. Thus analysis of synthetic videos was done manually and using 64-Bit Volocity analysis software. The synthetic video shown to the right was used as an input for the tracking of synthetic cells.
Volocity
Volocity 64-Bit was used to analyse synthetic videos created. The following protocol was followed:
- Filter images using SD intensity of lower limit -100 and upper limit -35. This is to select cells which have a dark cell body.
- Set tracking method to trajectory variation
- Check the box "Ignore Stationary Objects" to disable tracking of the image border
- Set displacement estimation to automatic
- Begin tracking using Ctrl-U
Manual Tracking
Synthetic cells were tracked using ImageJ via the Manual Tracking Plugin. The following protocol was followed:
- Save .avi movie as an image sequence and then import image sequence.
- Start Manual Tracking Plugin.
- Identify the cell of interest and start new track.
- Click on the centroid of the cell of interest. This will cause the image to advance to the next frame. Continue till the cell exits field of view
- Once tracking is complete, end track and save results with a .xls extension.
Validation Process
A synthetic video of five cells with changing shape was used in the evaluation of tracking software. Each cell was tracked using respective tracking software, and their coordinates in pixels were obtained.
The following steps were taken to analyse tracking data:
- Convert synthetic trajectory coordinate points into pixels.
- Calculate the displacement in each frame for both synthetic and tracking data
- Calculate the distance travelled in each frame for both synthetic and tracking data
- Obtain the errors in coordinates, displacement and distance travelled by the cell
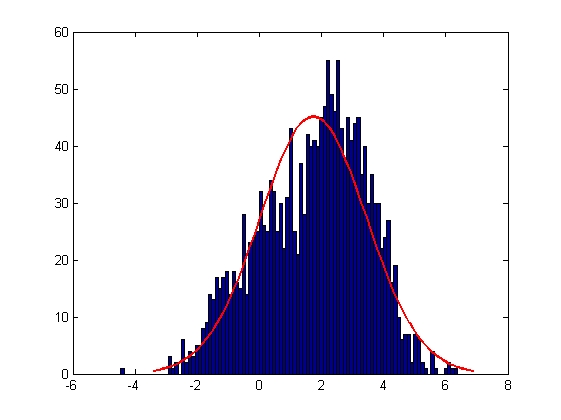
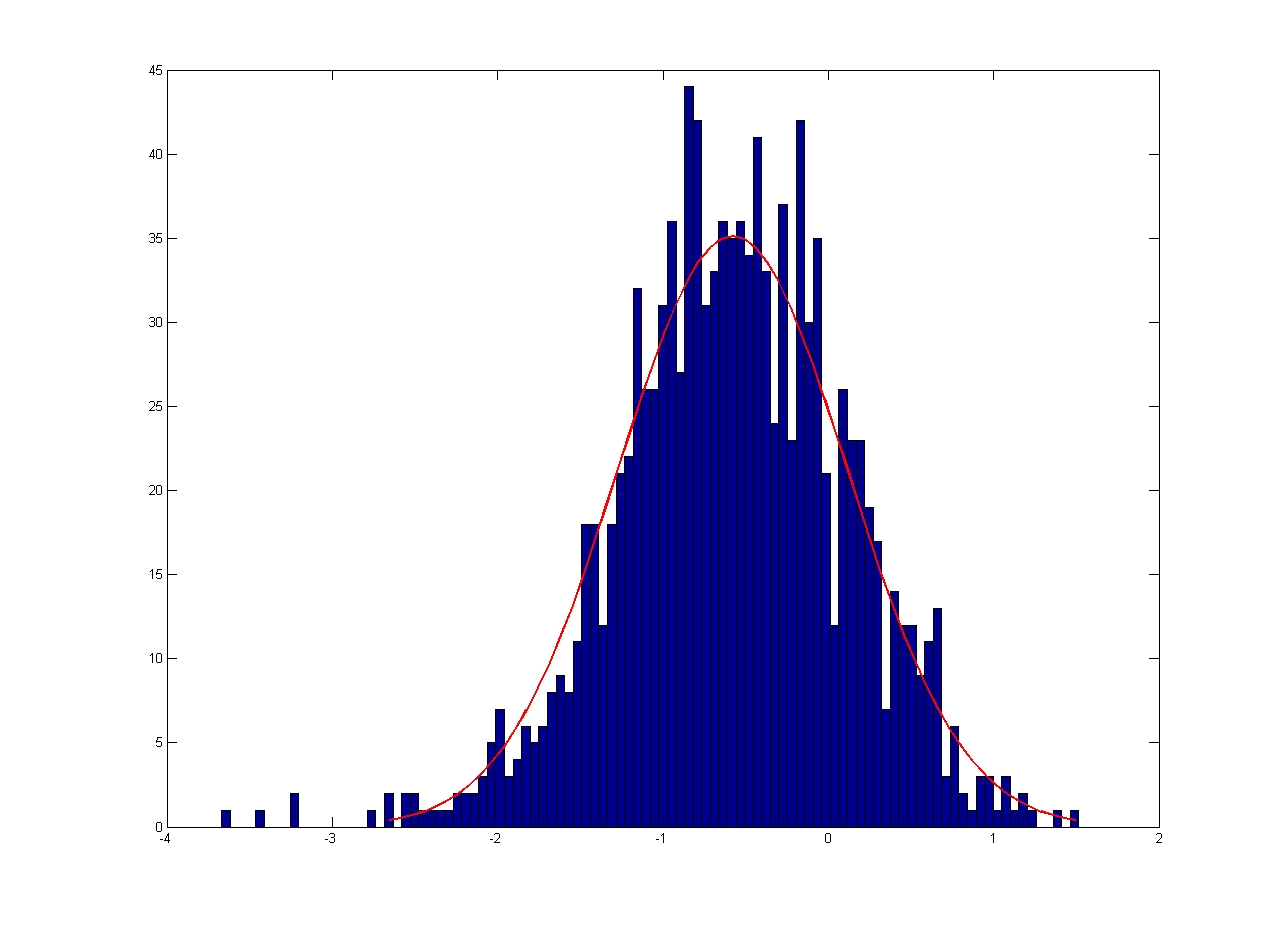
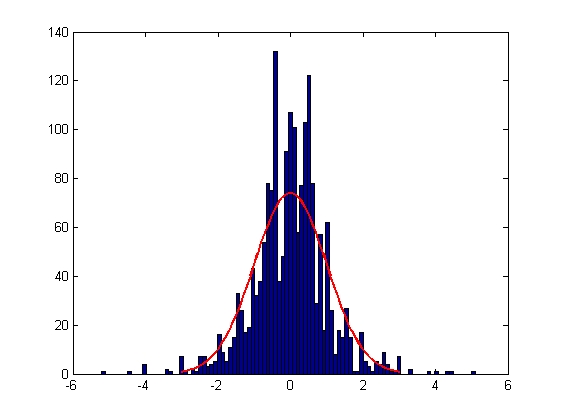
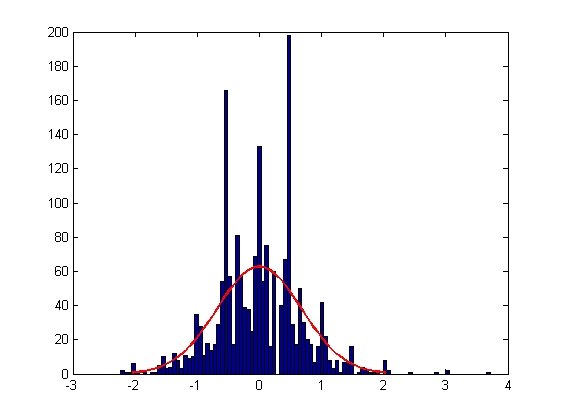
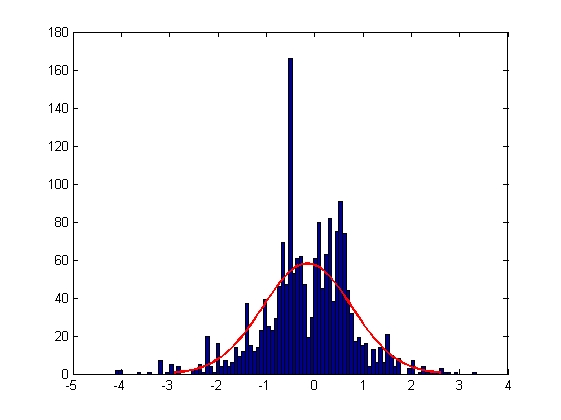
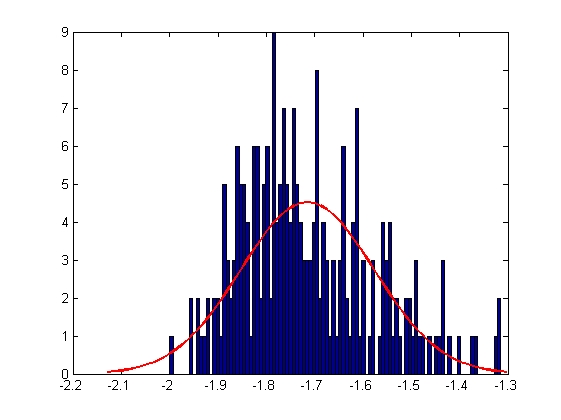
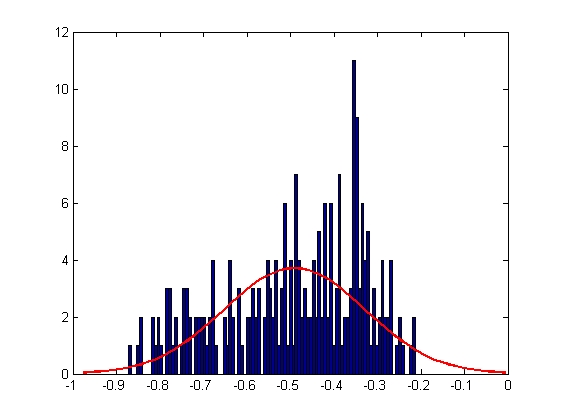
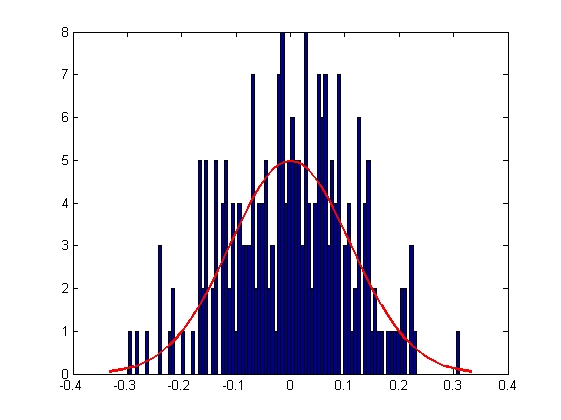
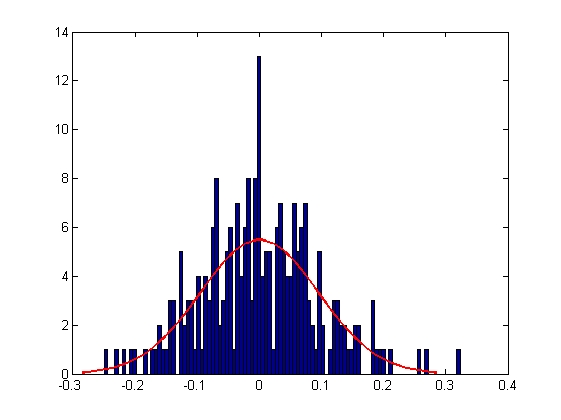
The errors associated with manual tracking and Volocity software are shown below. All errors are given in terms of pixels.
Manual Tracking
| Error in X Coordinate
| Error in Y Coordinate
|
| 
|
| Mean = 1.7354, Standard Deviation = 1.7187
| Mean = 1.2524, Standard Deviation = 1.0568
|
| Error in X Displacement
| Error in Y Displacement
| Error in Distance
|
| 
| 
|
| Mean = -0.0022, Standard Deviation = 1.0002
| Mean = -0.0018, Standard Deviation = 0.6795
| Mean = -0.1506, Standard Deviation = 0.9196
|
Volocity
| Error in X Coordinate
| Error in Y Coordinate
|
| 
|
| Mean = -1.7149, Standard Deviation = 0.1376
| Mean = -0.4907, Standard Deviation = 0.1614
|
| Error in X Displacement
| Error in Y Displacement
| Error in Distance
|
| 
| 
|
| Mean = 8.2732e-005, Standard Deviation = 0.1111
| Mean = 6.1416e-004, Standard Deviation = 0.0712
| Mean = 1.4262e-004, Standard Deviation = 0.0947
|
Evaluation
|
| Volocity
| Manual Tracking
|
| Pros
| Lower error in terms of tracking centroid than other tracking software.
Less time consuming.
| Able to discern cells visually.
Able track over larger number of frames.
|
| Cons
| Failure to track cells continuously over a long number of frames > 70.
Biased to cells which run, rather than tumble.
Failure to discern motile from immotile or dead cells.
| Time consuming.
Higher error in terms of tracking centroid as compared to tracking software.
|
Conclusion
- Manual tracking will be used to track B. subtilis.
[[Team:Imperial_College/{{{1}}}|< Previous]]
|
| [[Team:Imperial_College/{{{2}}}|Next >]]
|
|
 "
"


