Valencia/fit
From 2008.igem.org
(Difference between revisions)
| Line 10: | Line 10: | ||
Ilustrative curve of the behavior of the four variables under consideration (growth rate, galactose concentration, thermogenin concentratio, temperature increase). | Ilustrative curve of the behavior of the four variables under consideration (growth rate, galactose concentration, thermogenin concentratio, temperature increase). | ||
| + | |||
| + | [[Image:Valencia175.JPG|600px]] | ||
==175 deleted== | ==175 deleted== | ||
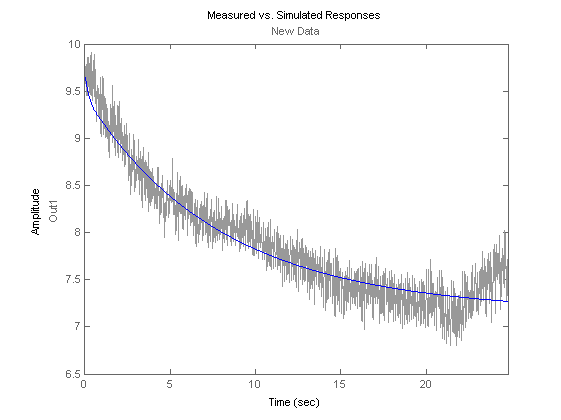
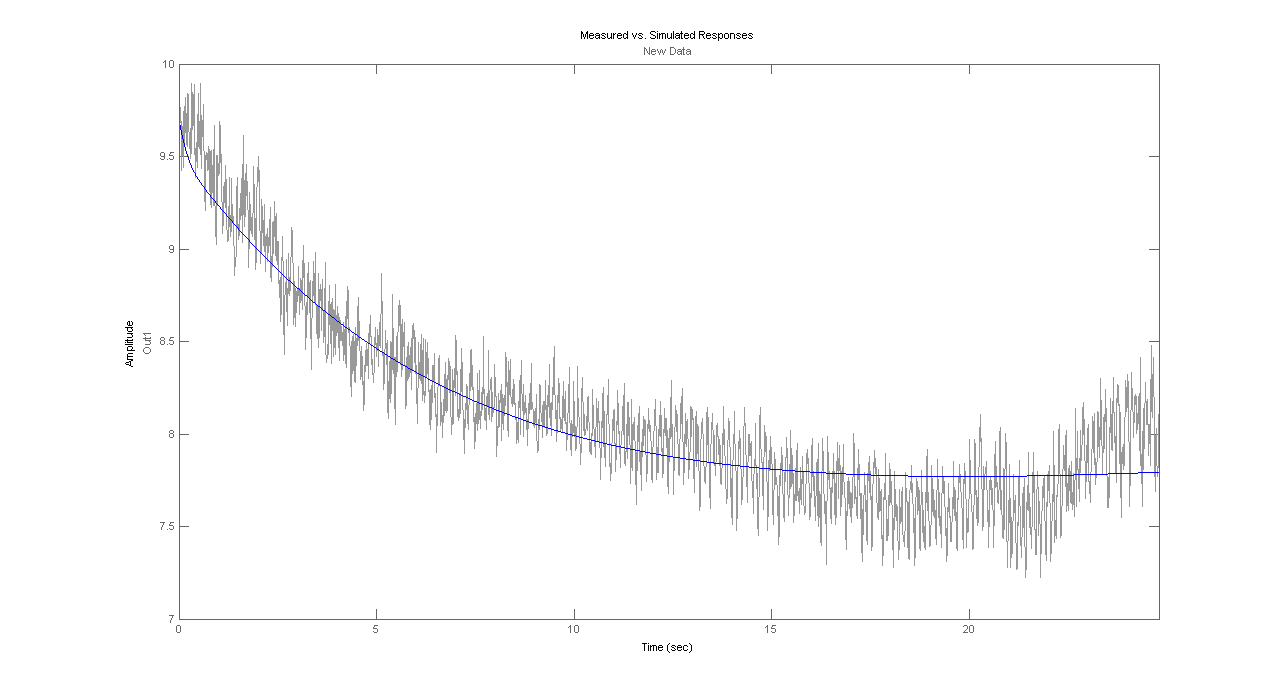
Theoretical fit of the experimental data | Theoretical fit of the experimental data | ||
| - | [[Image:V_175_measured.jpg| | + | [[Image:V_175_measured.jpg|600px]] |
| Line 20: | Line 22: | ||
Theoretical fit of the experimental data | Theoretical fit of the experimental data | ||
| - | [[Image:V_76_dormir.jpg| | + | [[Image:V_76_dormir.jpg|600px]] |
Revision as of 16:58, 29 October 2008
In this page we show some ilustrative results of the different fits.
Ilustrative curve of the behavior of the four variables under consideration (growth rate, galactose concentration, thermogenin concentratio, temperature increase).
175 deleted
Theoretical fit of the experimental data
76 deleted
Theoretical fit of the experimental data

 "
"

