Valencia/fit
From 2008.igem.org
| Line 9: | Line 9: | ||
In this page we show some ilustrative results of the different fits. | In this page we show some ilustrative results of the different fits. | ||
| - | + | Curve of the behavior of the four variables under consideration (growth rate, galactose concentration, thermogenin concentratio, temperature increase). | |
[[Image:Valencia175.JPG|600px]] | [[Image:Valencia175.JPG|600px]] | ||
Revision as of 17:05, 29 October 2008
In this page we show some ilustrative results of the different fits.
Curve of the behavior of the four variables under consideration (growth rate, galactose concentration, thermogenin concentratio, temperature increase).
This figures reproduce the behavior of the system for the strain 175Δ The galactose is consumed between the first and the second our of the experiment and the half life of the UCP is quite important as there is a very significant concentration of it after 24 h.
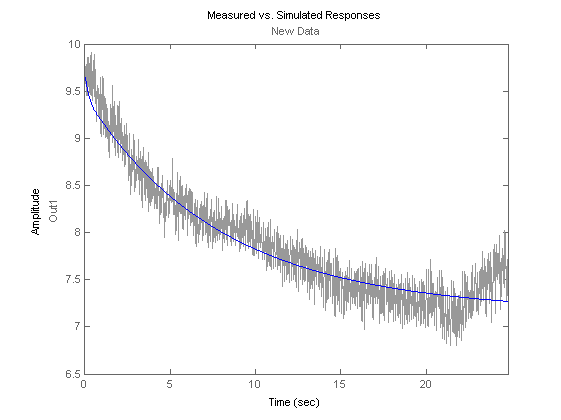
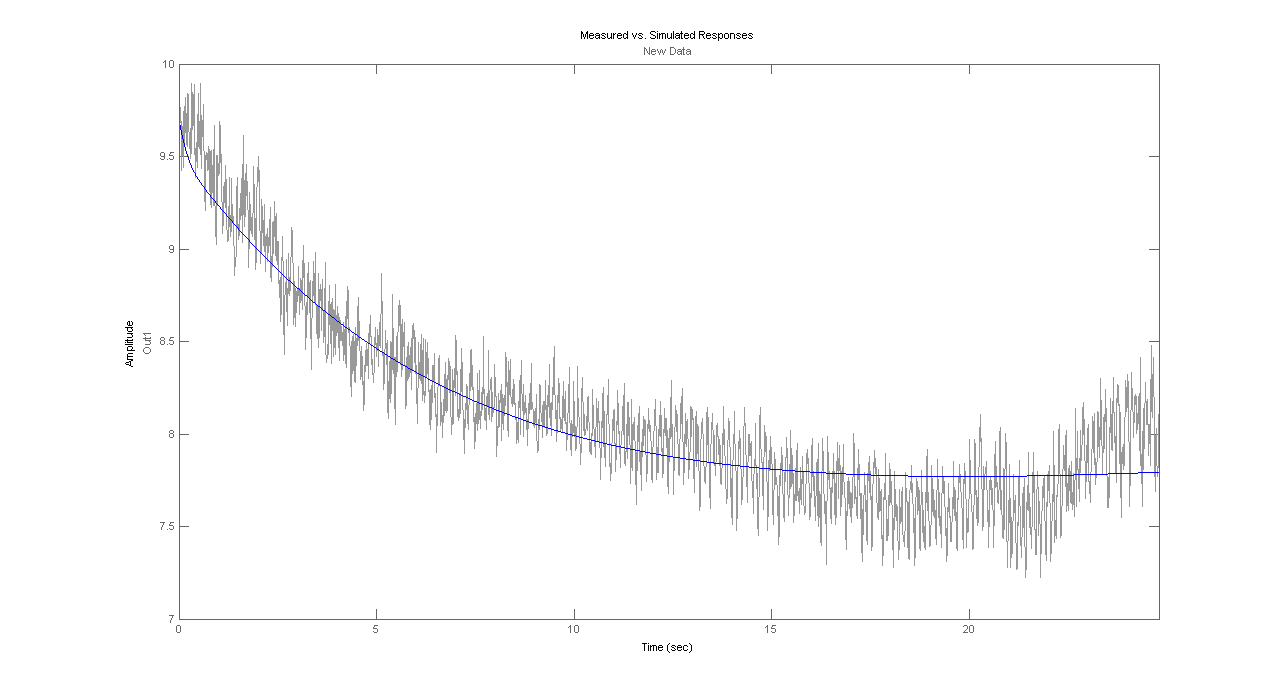
This figure represents the results of the strain UCP-, it can be seen that consistently there is no expresion of thermogenin, and the temperature decreases driven by the thermal losses of the calorimeter.
175 deleted
Theoretical fit of the experimental data
76 deleted
Theoretical fit of the experimental data

 "
"


