Team:Imperial College/Growth Curve
From 2008.igem.org
| Line 63: | Line 63: | ||
| - | + | }} | |
| - | + | ||
| - | + | ||
{{Imperial/Box1|Results| | {{Imperial/Box1|Results| | ||
| + | |||
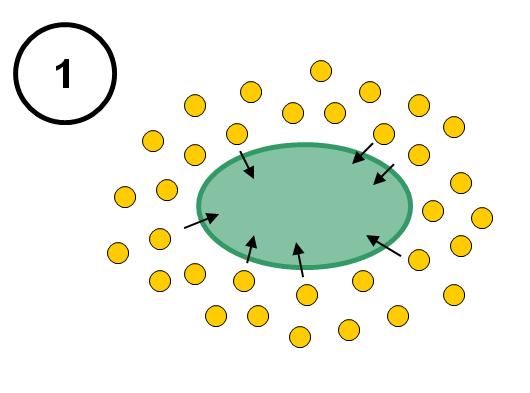
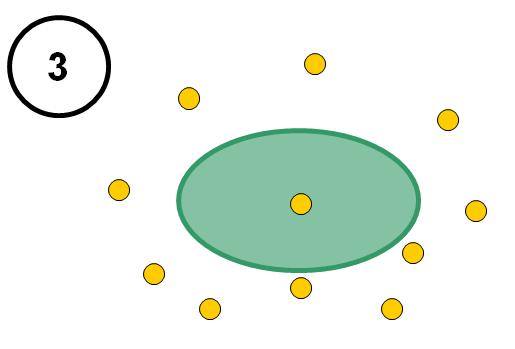
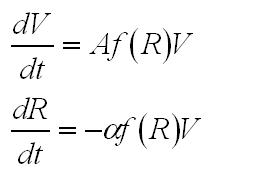
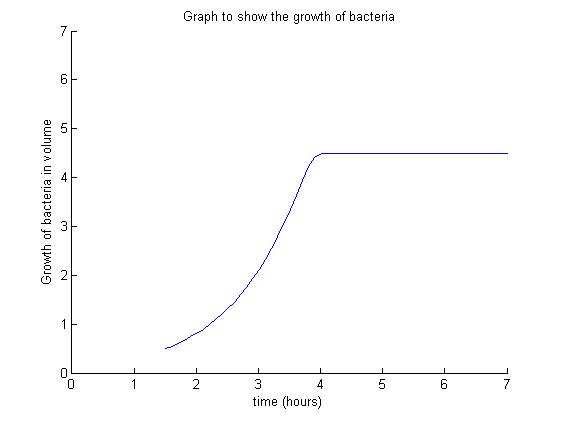
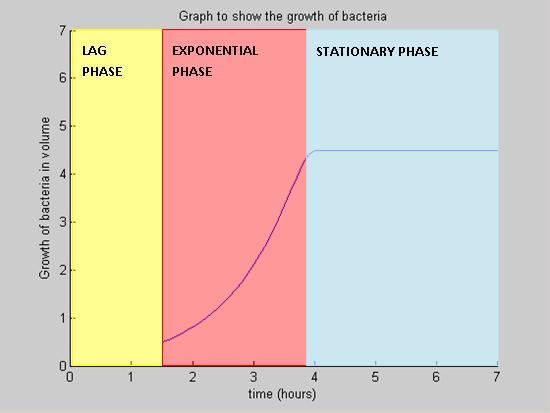
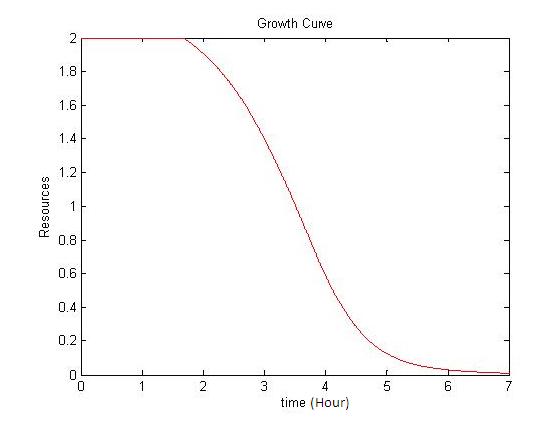
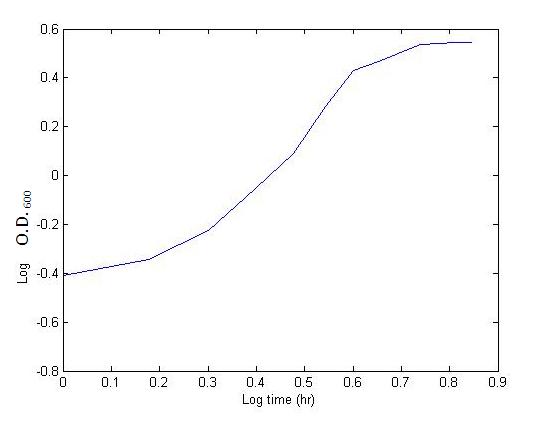
| + | Below is a typical model used for modelling the growth of bacteria. A high growth rate, as illustrated by the model below, will cause nutrients to be uptaken quickly resulting in a 'nutrient crash'. As the amount of resources are limited, the growth curve eventually become flat in the stationary phase. This is when the growth of the bacteria ceases. | ||
| + | |||
| + | <center>[[Image:nutrient_ft.JPG|350px]][[Image:Label_model.JPG|350px]]</center> | ||
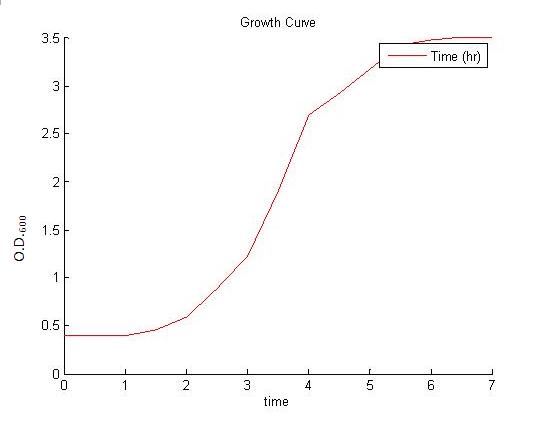
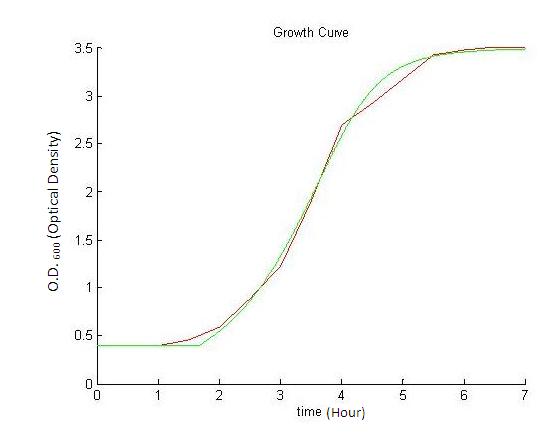
The model for the growth curve was fitted to the experimental results. The results are shown below. The experimental results are depicted by the red curve, while our model is shown by the green curve. The resource curve was also plotted as a function of time and is shown below. | The model for the growth curve was fitted to the experimental results. The results are shown below. The experimental results are depicted by the red curve, while our model is shown by the green curve. The resource curve was also plotted as a function of time and is shown below. | ||
Revision as of 20:59, 29 October 2008
Modelling the Growth Curve
|
|||||||||||
 "
"

