Team:NTU-Singapore/Modelling/Sensitivity Analysis
From 2008.igem.org
Lalala8585 (Talk | contribs) |
(→Sensitivity Analysis) |
||
| (11 intermediate revisions not shown) | |||
| Line 4: | Line 4: | ||
<div id="maincontent" style="margin-top:200px;"> | <div id="maincontent" style="margin-top:200px;"> | ||
| - | =Sensitivity Analysis= | + | ='''Sensitivity Analysis'''= |
| - | + | Sensitivty analyses for the two systems were performed using [http://www.sbtoolbox2.org/main.php SBtoolbox 2]. The reason for performing this analysis is to find out which are the important parameters and would have a major effects on the experimental results. A part of the reason is because some of the parameters were fitted and not obtained strictly from literature. This analysis would allow us to plan for experiments while taking into account the effect these parameters may have. | |
| - | == | + | ==E7 production system Sensitivity Analysis== |
| - | [[Image:Sensitivty_for_lactose.jpg|800px|Sensitivity]]<br> | + | [[Image:Sensitivty_for_lactose.jpg|thumb|center|800px|Sensitivity Analysis for E7 Production]]<br> |
| - | [[Image:Lactose_adjust.jpg|800px| | + | [[Image:Lactose_adjust.jpg|800px|thumb|center|New E7 production ]]<br> |
| - | We can compare the new adjusted E7 production system with the [https://2008.igem.org/Team:NTU-Singapore/Modelling/Deterministic_Modeling#E7_production_system previous modeling exercise]. The E7 and immunity protein production has been cut down. | + | We can compare the new adjusted E7 production system with the [https://2008.igem.org/Team:NTU-Singapore/Modelling/Deterministic_Modeling#E7_production_system previous modeling exercise]. The E7 and immunity protein production has been cut down. |
| - | ==Lysis Sensitivity Analysis== | + | == Detection & Lysis production Sensitivity Analysis== |
| - | + | ||
| + | |||
| + | [[Image:Sensitivity_for_lysis.jpg|800px|thumb|center|Sensitivity analysis for Detection & Lysis system]] | ||
The Sensitivity analysis revealed that the degradation rate of Proteins was a major factor and the previous assumption was not that accurate. The value for protein degradation was adjusted by assuming that the half time for protein degradation is 10 minutes. The new Lysis output according to the model is as follows. | The Sensitivity analysis revealed that the degradation rate of Proteins was a major factor and the previous assumption was not that accurate. The value for protein degradation was adjusted by assuming that the half time for protein degradation is 10 minutes. The new Lysis output according to the model is as follows. | ||
| - | [[Image:Lysis_adjust.jpg|800px|Lysis]]<br> | + | [[Image:Lysis_adjust.jpg|thumb|center|800px|Detection & Lysis System Version 1]]<br> |
| + | |||
| + | As we can see, the output of protein has been drastically reduced from the [https://2008.igem.org/Team:NTU-Singapore/Modelling/Deterministic_Modeling#Lysis_Production_system previous modeling exercise] for the Detection & Lysis Protein Production system. | ||
| + | <br><br> | ||
| + | <html> | ||
| + | <script language=Javascript1.2> | ||
| + | <!-- | ||
| + | |||
| + | var tags_before_clock = "<b>It is now " | ||
| + | var tags_middle_clock = "on" | ||
| + | var tags_after_clock = "</b>" | ||
| + | |||
| + | if(navigator.appName == "Netscape") { | ||
| + | document.write('<layer id="clock"></layer><br>'); | ||
| + | } | ||
| + | |||
| + | if (navigator.appVersion.indexOf("MSIE") != -1){ | ||
| + | document.write('<span id="clock"></span>'); | ||
| + | } | ||
| + | |||
| + | DaysofWeek = new Array() | ||
| + | DaysofWeek[0]="Sunday" | ||
| + | DaysofWeek[1]="Monday" | ||
| + | DaysofWeek[2]="Tuesday" | ||
| + | DaysofWeek[3]="Wednesday" | ||
| + | DaysofWeek[4]="Thursday" | ||
| + | DaysofWeek[5]="Friday" | ||
| + | DaysofWeek[6]="Saturday" | ||
| + | |||
| + | Months = new Array() | ||
| + | Months[0]="January" | ||
| + | Months[1]="February" | ||
| + | Months[2]="March" | ||
| + | Months[3]="April" | ||
| + | Months[4]="May" | ||
| + | Months[5]="June" | ||
| + | Months[6]="July" | ||
| + | Months[7]="August" | ||
| + | Months[8]="September" | ||
| + | Months[9]="October" | ||
| + | Months[10]="November" | ||
| + | Months[11]="December" | ||
| + | |||
| + | function upclock(){ | ||
| + | var dte = new Date(); | ||
| + | var hrs = dte.getHours(); | ||
| + | var min = dte.getMinutes(); | ||
| + | var sec = dte.getSeconds(); | ||
| + | var day = DaysofWeek[dte.getDay()] | ||
| + | var date = dte.getDate() | ||
| + | var month = Months[dte.getMonth()] | ||
| + | var year = dte.getFullYear() | ||
| + | |||
| + | var col = ":"; | ||
| + | var spc = " "; | ||
| + | var com = ","; | ||
| + | var apm; | ||
| + | |||
| + | if (date == 1 || date == 21 || date == 31) | ||
| + | {ender = "<sup>st</sup>"} | ||
| + | else | ||
| + | if (date == 2 || date == 22) | ||
| + | {ender = "<sup>nd</sup>"} | ||
| + | else | ||
| + | if (date == 3 || date == 23) | ||
| + | {ender = "<sup>rd</sup>"} | ||
| + | |||
| + | else | ||
| + | {ender = "<sup>th</sup>"} | ||
| + | |||
| + | if (12 < hrs) { | ||
| + | apm="<font size='-1'>pm</font>"; | ||
| + | hrs-=12; | ||
| + | } | ||
| + | |||
| + | else { | ||
| + | apm="<font size='-1'>am</font>"; | ||
| + | } | ||
| + | |||
| + | if (hrs == 0) hrs=12; | ||
| + | if (hrs<=9) hrs="0"+hrs; | ||
| + | if (min<=9) min="0"+min; | ||
| + | if (sec<=9) sec="0"+sec; | ||
| + | |||
| + | if(navigator.appName == "Netscape") { | ||
| + | document.clock.document.write(tags_before_clock+hrs+col+min+col+sec+apm+spc+tags_middle_clock+spc+day+com+spc+date+ender+spc+month+com+spc+year+tags_after_clock); | ||
| + | document.clock.document.close(); | ||
| + | } | ||
| + | |||
| + | if (navigator.appVersion.indexOf("MSIE") != -1){ | ||
| + | clock.innerHTML = tags_before_clock+hrs+col+min+col+sec+apm+spc+tags_middle_clock+spc+day+com+spc+date+ender+spc+month+com+spc+year+tags_after_clock; | ||
| + | } | ||
| + | } | ||
| - | + | setInterval("upclock()",1000); | |
| - | + | //--> | |
| + | </script> | ||
| + | </html> | ||
Latest revision as of 12:49, 28 October 2008
|
Sensitivity Analysis
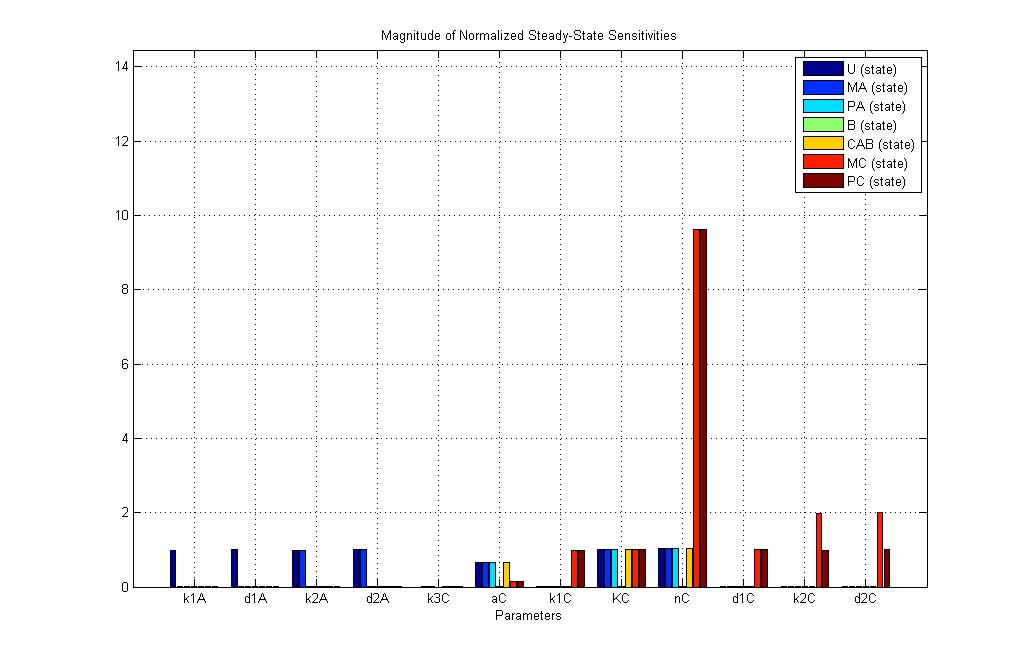
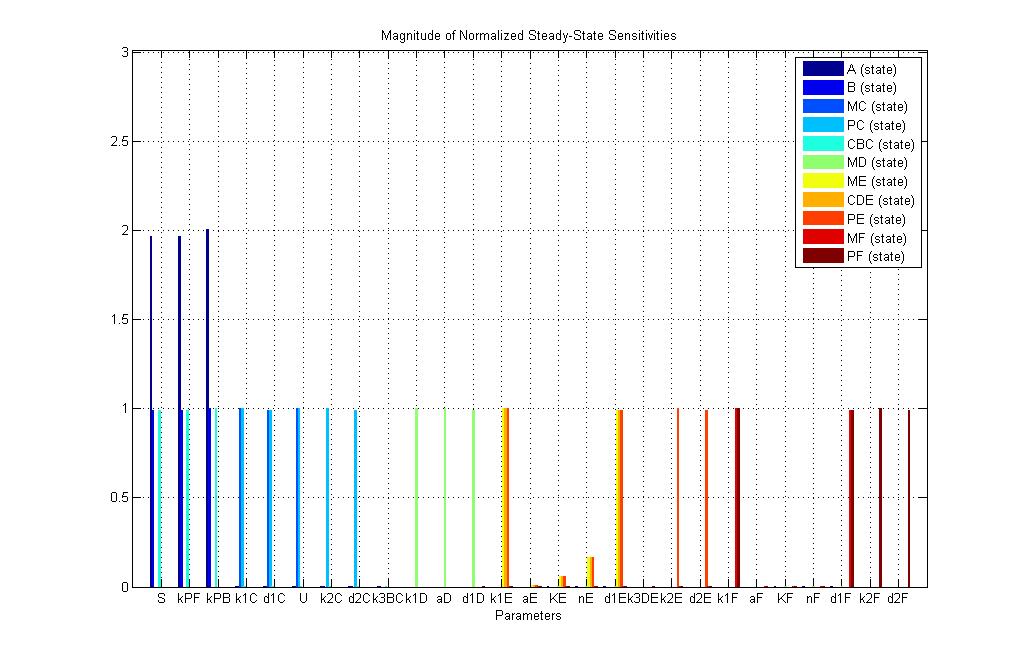
Sensitivty analyses for the two systems were performed using [http://www.sbtoolbox2.org/main.php SBtoolbox 2]. The reason for performing this analysis is to find out which are the important parameters and would have a major effects on the experimental results. A part of the reason is because some of the parameters were fitted and not obtained strictly from literature. This analysis would allow us to plan for experiments while taking into account the effect these parameters may have.
E7 production system Sensitivity Analysis
We can compare the new adjusted E7 production system with the previous modeling exercise. The E7 and immunity protein production has been cut down.
Detection & Lysis production Sensitivity Analysis
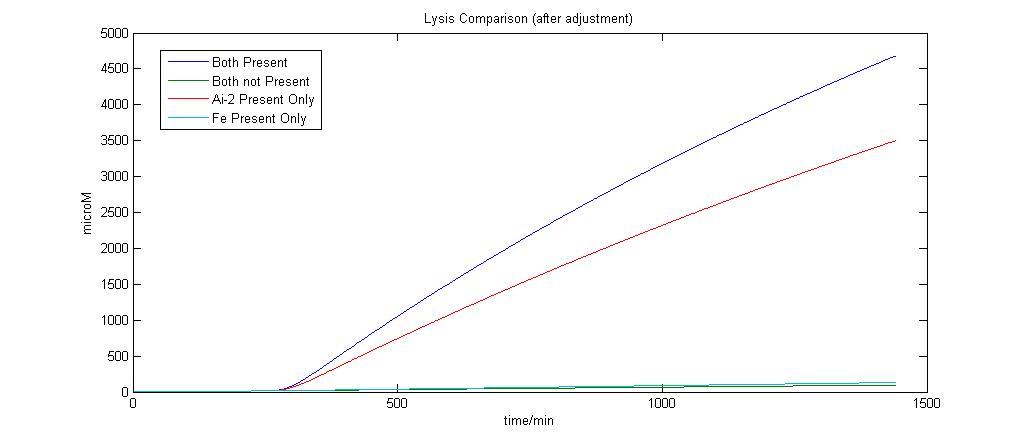
The Sensitivity analysis revealed that the degradation rate of Proteins was a major factor and the previous assumption was not that accurate. The value for protein degradation was adjusted by assuming that the half time for protein degradation is 10 minutes. The new Lysis output according to the model is as follows.
As we can see, the output of protein has been drastically reduced from the previous modeling exercise for the Detection & Lysis Protein Production system.
 "
"


