Team:Groningen/Modeling
From 2008.igem.org
(→Spatial Model) |
(→Modelling) |
||
| (17 intermediate revisions not shown) | |||
| Line 3: | Line 3: | ||
=='''Modelling'''== | =='''Modelling'''== | ||
To gain insight into the working of our designs we try to develop reliable and realistic models. In our project we took two different approaches: an elaborate single-cell model and a 'higher level' spatial model. In the sections below we will give a summary of the findings concerning our models, for more details we refer to our full report. | To gain insight into the working of our designs we try to develop reliable and realistic models. In our project we took two different approaches: an elaborate single-cell model and a 'higher level' spatial model. In the sections below we will give a summary of the findings concerning our models, for more details we refer to our full report. | ||
| + | |||
| + | Our network is depicted in the image below, the idea behind it is that when there is a low concentration of HSL, there will be no GFP response as the Plux/cI promoter is not yet activated. When HSL levels are increased, the Plux/cI promoter activates and the cell expresses GFP. When HSL levels get too high, however, the weaker Lux* promoter gets activate, resulting in expression of cI, which blocks the Plux/cI promoter. The result is a switch that is active only when HSL levels are in-between two thresholds. | ||
| + | |||
| + | [[Image:rug.model.png]] | ||
==Single Cell Model== | ==Single Cell Model== | ||
| Line 15: | Line 19: | ||
When we run our model with default parameters, most closely resembling the parameters found in other publications we get the results shown below. In this image we can clearly see that cells that are close (too close) to the sender cell, are turned of (having too many neighbours) as well as the cells that are too far from the sender (having too few neighbours). | When we run our model with default parameters, most closely resembling the parameters found in other publications we get the results shown below. In this image we can clearly see that cells that are close (too close) to the sender cell, are turned of (having too many neighbours) as well as the cells that are too far from the sender (having too few neighbours). | ||
| - | + | <gallery> | |
| + | Image:Rug.Band_prod1_0_001.png|Single sender cell, standard parameters | ||
| + | Image:Band_prod1_0_001_2s.png|Two sender cells, standard parameters | ||
| + | </gallery> | ||
| + | |||
| + | The next step is tweaking the parameters so that it does exactly what we want, for example we can decrease the sensitivity of the promoter that inhibits the output (ie. the high threshold), when we do this we can increase the width of the band that forms around the sender cell, as in the image below. | ||
| + | |||
| + | [[Image:band_prod1_0_001_1s_0_16k.png]] | ||
| + | |||
| + | Another way to change the behaviour of the network is by decreasing the diffusion speed, in practice this can be done by making the medium through which the HSL diffusion less permeable. This effectively brings the band closer to the sender cell. Another way of achieving this goal is by increasing the decay rate of HSL, which can be done by change the PH levels in the medium. | ||
| + | |||
| + | With these 'parameters' we can tweak the network to our goal, as part of a cellular automaton. To demonstrate this functionality of the part, we try to create the simple case of a cell which is on when it has exactly one neighbour and is off when it has more or less (ie. 0 or 2 neighbours). After trying out several settings we found that we can achieve this by decreasing HSL diffusion and simultaniously increasing HSL decay (exact values can be found in our report), this results in the situation below. | ||
| + | |||
| + | [[Image:band_prod1_0_00001_2s_close_0_03.png]] | ||
==''Modeling''== | ==''Modeling''== | ||
Latest revision as of 19:43, 11 October 2008
Modelling
To gain insight into the working of our designs we try to develop reliable and realistic models. In our project we took two different approaches: an elaborate single-cell model and a 'higher level' spatial model. In the sections below we will give a summary of the findings concerning our models, for more details we refer to our full report.
Our network is depicted in the image below, the idea behind it is that when there is a low concentration of HSL, there will be no GFP response as the Plux/cI promoter is not yet activated. When HSL levels are increased, the Plux/cI promoter activates and the cell expresses GFP. When HSL levels get too high, however, the weaker Lux* promoter gets activate, resulting in expression of cI, which blocks the Plux/cI promoter. The result is a switch that is active only when HSL levels are in-between two thresholds.
Single Cell Model
Spatial Model
In order to create a spatial model of our system we simplified the single-cell model using Hill-equations, in these equations several reactions are combined into a single Ordinary Differential Equation. As an example consider a Lux inducible promoter which is followed by the GFP gene; in our single-cell model we would have a separate equation for each reaction taking place whereas in our spatial model this would be represented as a single equation that gives the production of GFP as a function of the amount of Lux present.
We this approach we ended up with a single ODE for each species (HSL, HSL:luxR, luxR, cI and GFP), these formula were were then solved using MATLAB's ode15s solver.
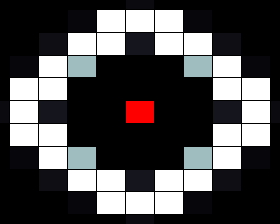
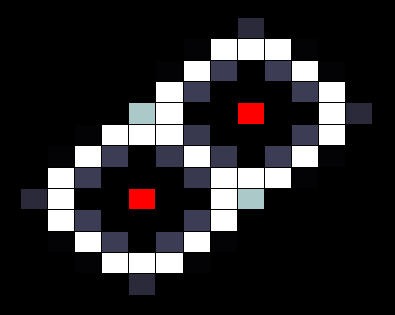
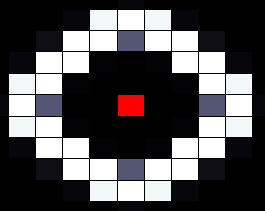
In our spatial model we used a grid where each cell is connected to four neighbours (left, right, top and bottom), with HSL diffusing freely to and from each connected cell according to a certain diffusion constant. In the resulting images, taken after giving the system enough time to reach a stable state, the red cells depict sender cells, which produce a constant amount of HSL, the white cells represent cells in the 'ON' state, and black cells depict cells in the 'OFF' state.
When we run our model with default parameters, most closely resembling the parameters found in other publications we get the results shown below. In this image we can clearly see that cells that are close (too close) to the sender cell, are turned of (having too many neighbours) as well as the cells that are too far from the sender (having too few neighbours).
The next step is tweaking the parameters so that it does exactly what we want, for example we can decrease the sensitivity of the promoter that inhibits the output (ie. the high threshold), when we do this we can increase the width of the band that forms around the sender cell, as in the image below.
Another way to change the behaviour of the network is by decreasing the diffusion speed, in practice this can be done by making the medium through which the HSL diffusion less permeable. This effectively brings the band closer to the sender cell. Another way of achieving this goal is by increasing the decay rate of HSL, which can be done by change the PH levels in the medium.
With these 'parameters' we can tweak the network to our goal, as part of a cellular automaton. To demonstrate this functionality of the part, we try to create the simple case of a cell which is on when it has exactly one neighbour and is off when it has more or less (ie. 0 or 2 neighbours). After trying out several settings we found that we can achieve this by decreasing HSL diffusion and simultaniously increasing HSL decay (exact values can be found in our report), this results in the situation below.
Modeling
To gain insight into the working of our designs we try to develop reliable and realistic models.
The ODE solvers incorporated in the SimBiology package, for Mathworks' Matlab, are employed to model the genetic design on the single-cell level, displaying the variations in concentration of all relevant substances over time.
To examine the workings of our designs on the multi-cell level we are developing a routine in Matlab which can predict the collective behaviour of the designed cells on a two-dimensional grid. Hopefully this will help us to predict better the characteristics of HSL exchange between the cells.
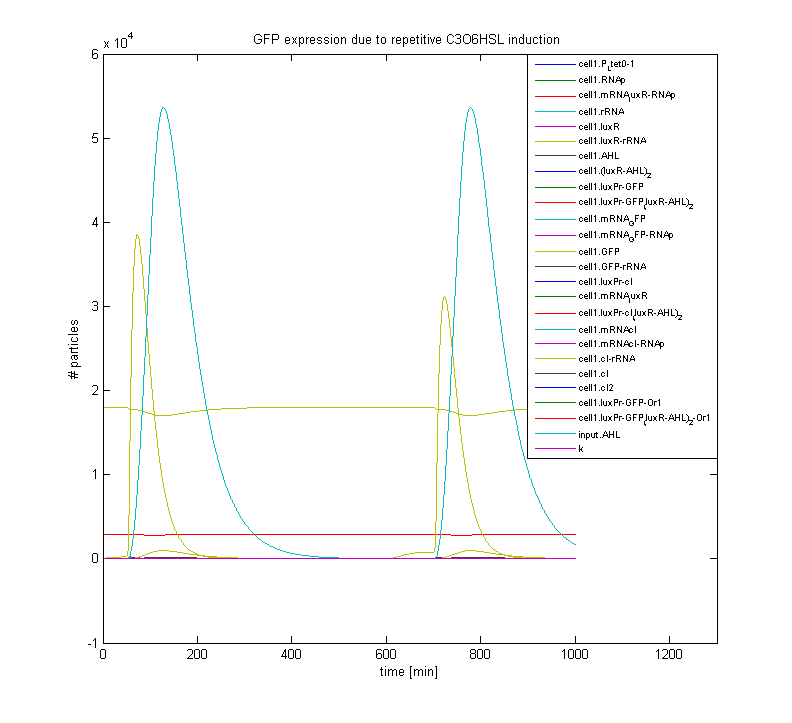
The figure below displays the response of a gene regulatory network, which incorporates an HSL sensing mechanism and a GFP reporter gene. Shown is the pulse-shaped GFP expression as a response to HSL induction; after induction the system relaxes towards its initial state, which makes it susceptible to repetitive stimuli.
 "
"

