Team:ETH Zurich/Modeling/Genome Static Analysis
From 2008.igem.org
Luca.Gerosa (Talk | contribs) (→Available restricion enzymes and digestion simulation) |
(→References) |
||
| (60 intermediate revisions not shown) | |||
| Line 4: | Line 4: | ||
</center> | </center> | ||
</html> | </html> | ||
| - | + | {|style="background:#FFFFFF ; border:3.5px solid #60AFFE; padding: 1em; margin: auto ; width:98.5% " | |
| - | + | ||
| - | + | ||
| - | {|style="background:# | + | |
|- | |- | ||
| | | | ||
| Line 13: | Line 10: | ||
==Restriction Enzyme Analysis== | ==Restriction Enzyme Analysis== | ||
| - | This section presents the computational investigation we performed in order to understand which restriction enzymes | + | This section presents the computational investigation we performed in order to understand which restriction enzymes cut the genome in fragments that most probably will lead to find the minimal genome in our reduction approach. It is important to note that this is a "statical" analysis: we do not include in the evaluation of the restriction enzyme optimality any prevision regarding the effects cutting patterns can have on cell physiology or cell system behavior. We address questions regarding the cell system response after genome reduction using more advanced modeling techniques (a genome scale model) in the [[Team:ETH_Zurich/Modeling/Genome-Scale_Model|Genome Scale Analysis section]]. We focus here only on the insights that can be obtained using three kinds of "statical" information: |
| - | * the genome sequence of our strain of interest (E. | + | * the genome sequence of our strain of interest (''E. coli'' K12 MG1655); |
| - | * the annotation information of our strain of interest (E. | + | * the annotation information of our strain of interest (''E. coli'' K12 MG1655); |
* the recognition site patterns of each of the restriction enzymes we test. | * the recognition site patterns of each of the restriction enzymes we test. | ||
| Line 22: | Line 19: | ||
* Which are the available restriction enzymes, their recognition sites and the fragments they generate after digestion? | * Which are the available restriction enzymes, their recognition sites and the fragments they generate after digestion? | ||
| - | * How is the distribution of the genes in each fragment related to the | + | * How is the distribution of the genes in each fragment related to the frequency of cutting? |
| - | * Is it possible to identify restriction enzymes that optimizes the probability of cutting out fragments of the genome but still keeping the cell alive (or better, do exist restriction enzymes that | + | * Is it possible to identify restriction enzymes that optimizes the probability of cutting out fragments of the genome but still keeping the cell alive (or better, do there exist restriction enzymes that rarely target fragments containing essential genes)? |
| + | |||
| + | ===Available restriction enzymes and digestion simulation=== | ||
| + | |||
| + | As source for the restriction enzyme to consider, we used the [http://rebase.neb.com/rebase/rebase.html REBASE database] (2). We found 713 restriction enzymes that spawn from 4 up to 13 cutters, some with complete specific recognition sites and some with unspecific site properties. Since some of the restriction enzymes present the same recognition site sequence, we grouped them together as a single entity to be tested (216 groups). We downloaded the genome and annotation information regarding E.Coli K12 MG1655 from the GenBank® database. We then simulated the digestion of E.Coli chromosome sequentially for each group of restriction enzymes and performed statistical analysis on the fragment patterns obtained. | ||
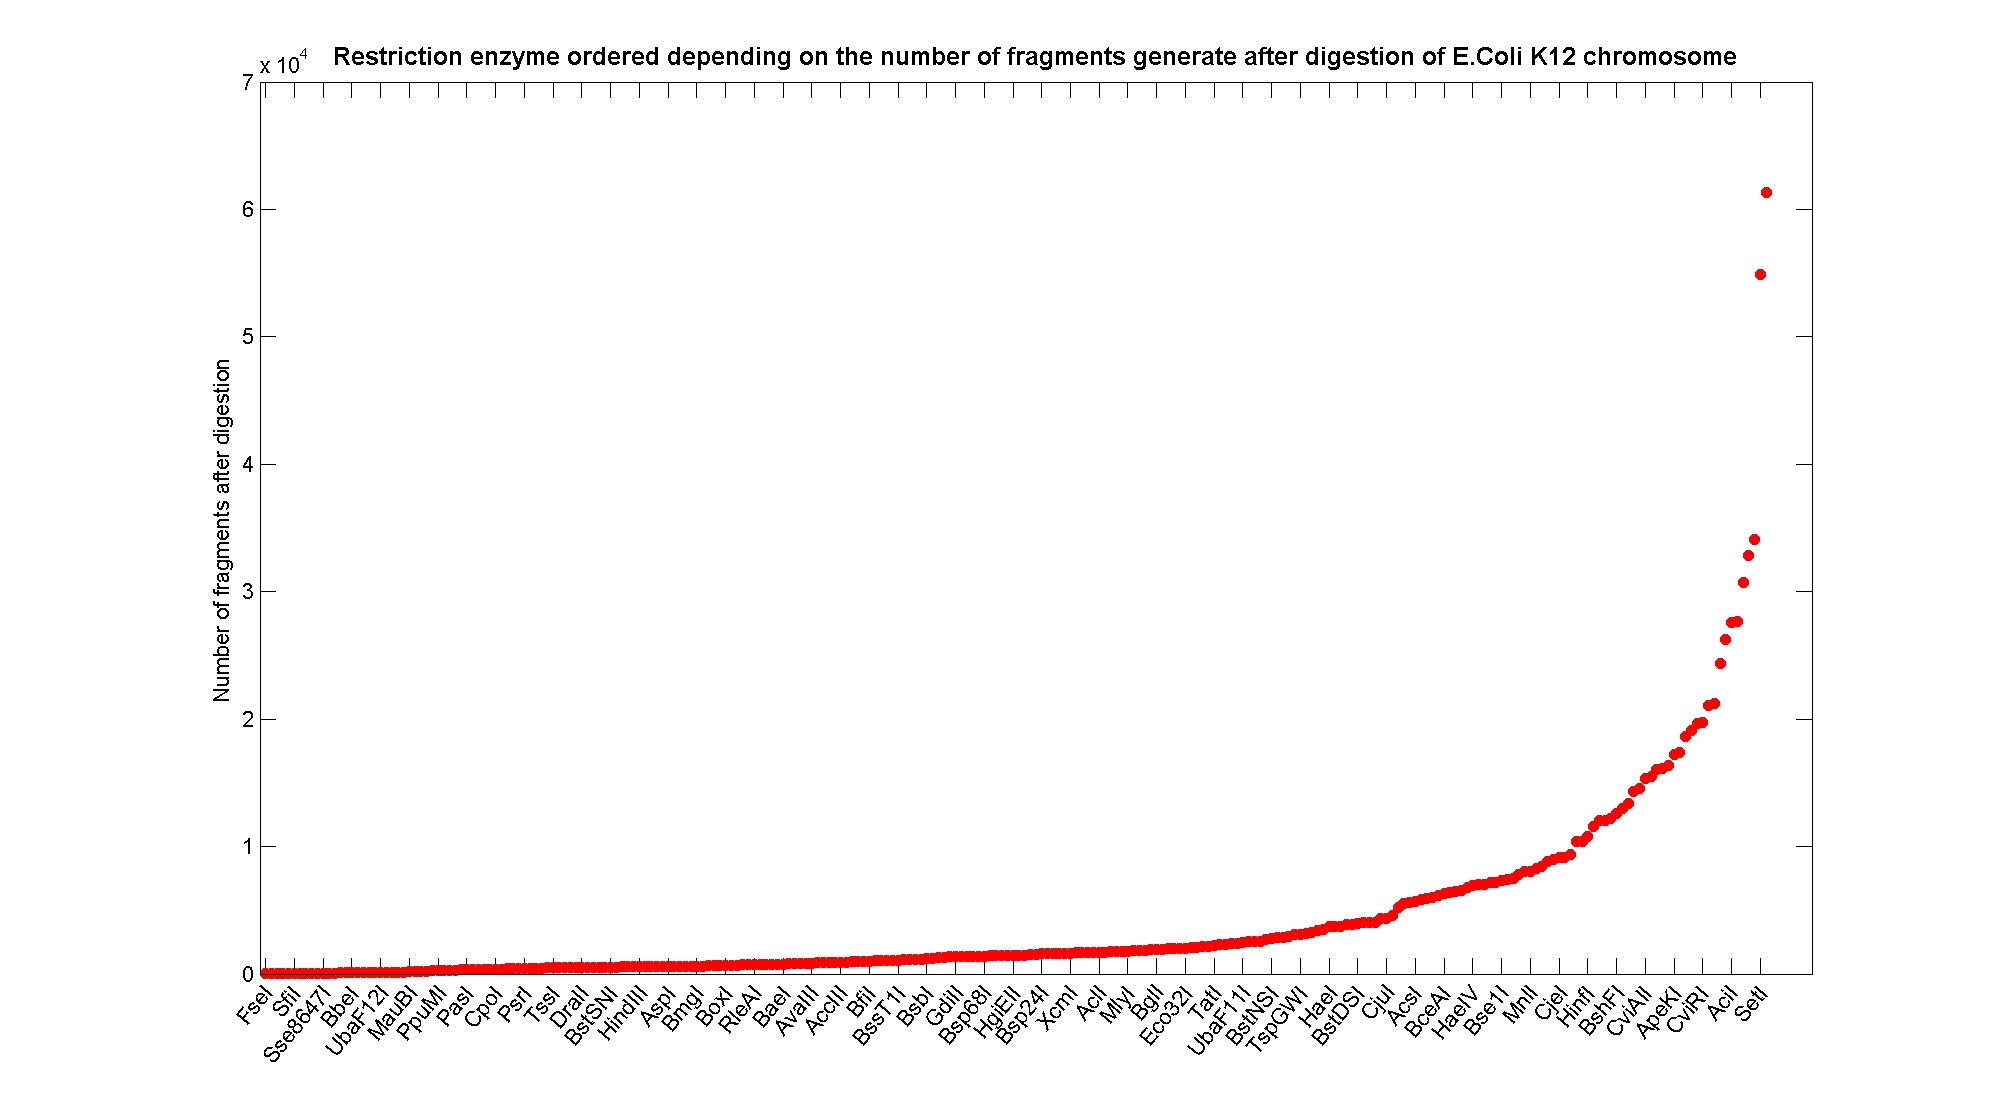
| + | The following pictures summarize the distribution of the available enzymes regarding their frequency of cutting (number of fragments after digestion): | ||
| + | |||
| + | [[Image:ResEnzymeVsFragmentNumber.jpg|center|900px|]] | ||
| + | |||
| + | It is possible to note that there is a huge number of restriction enzymes that digest the chromosome in few to high number of fragments (up to 10,000 fragments) and relatively fewer which generate a very high number of fragments. Please note that on the x axis, some of the enzyme groups have been omitted because of space problems and only one of each five has been reported. | ||
| + | |||
| + | === Analysing the gene content of the fragments === | ||
| + | |||
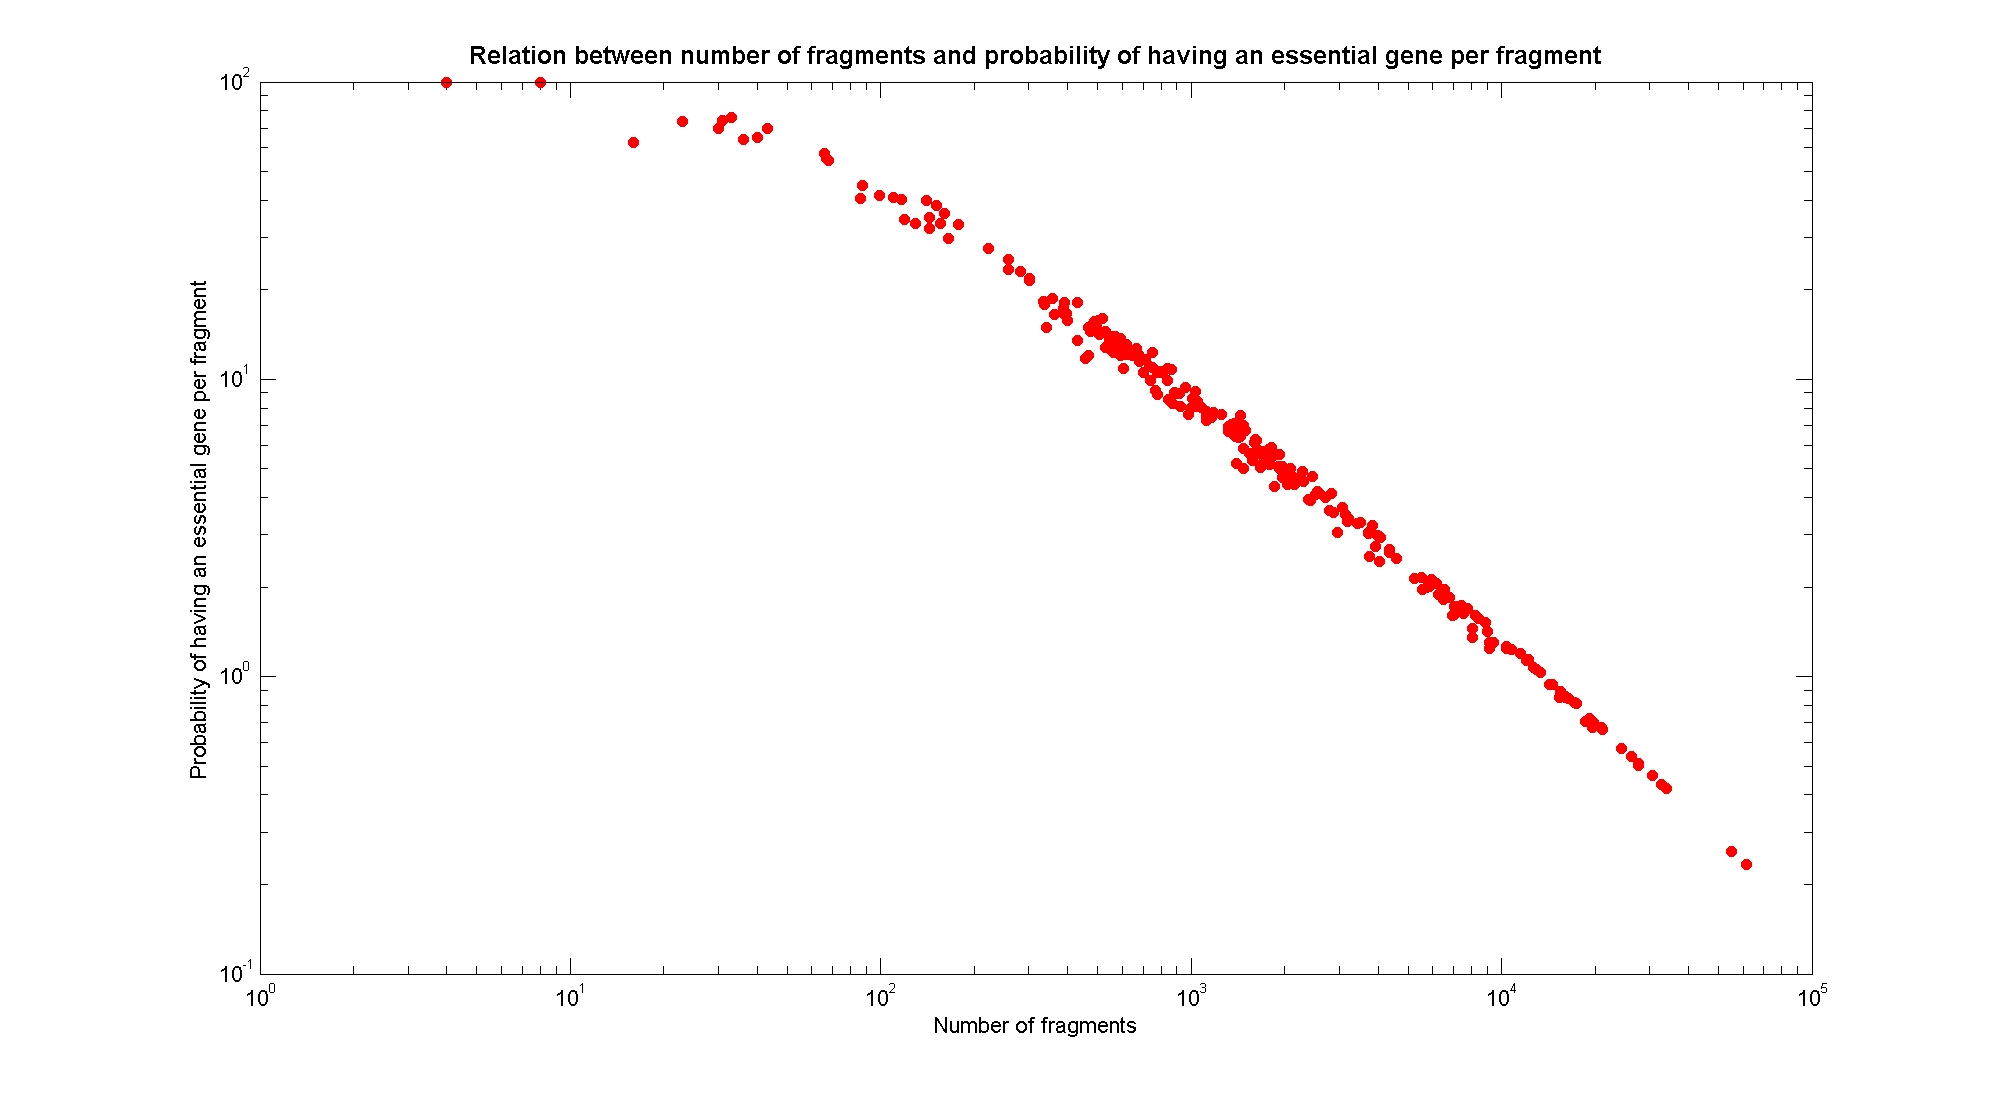
| + | In order to understand if there are restriction enzymes that have particular properties (for example the ability to target on the same fragments several essential genes, in order to reduce the probability of causing cell death) we performed some statistical analysis, calculating indexes such as: the mean and variance for fragment lengths, the mean and variance for gene numbers per fragment, the probability of one fragment to contain an essential gene. Here we show the graphs obtained by plotting these indexes. | ||
| + | |||
| + | {| border="1" align="center" | ||
| + | |- | ||
| + | | valign="top" align="center" width="450"| | ||
| + | [[Image:NumFragmentsVsMeanGene.jpg|center|900px|]] | ||
| + | <div style="text-align:justify;"> | ||
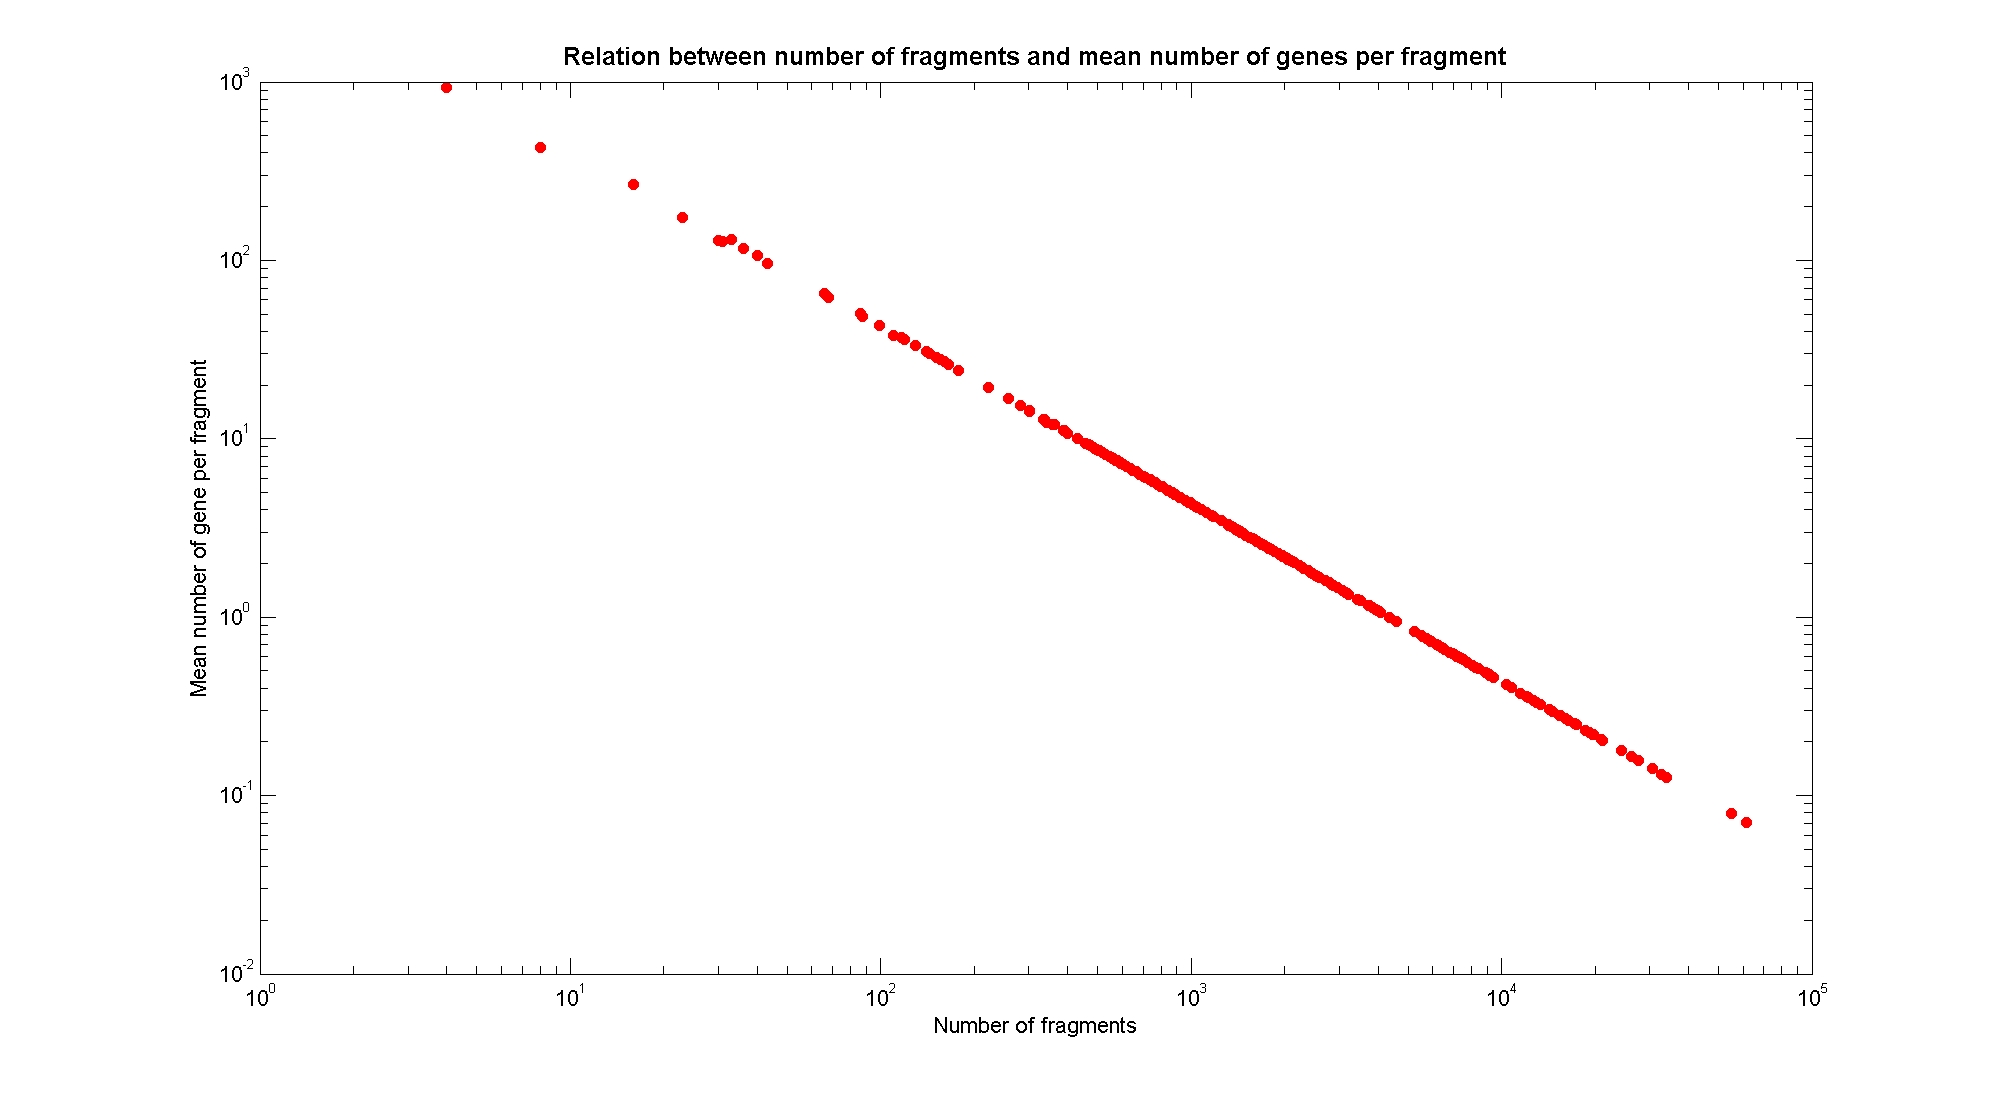
| + | Obviously, the mean number of genes per fragment follows an inverse linear relation with the number of fragments in a log-log plot, used as a check for the validity of our fragmentation algorithm. | ||
| + | </div> | ||
| + | |- | ||
| + | | valign="top" align="center" width="450"| | ||
| + | [[Image:numFragmentsVsVarGene.jpg|center|900px|]] | ||
| + | <div style="text-align:justify;"> | ||
| + | </div> | ||
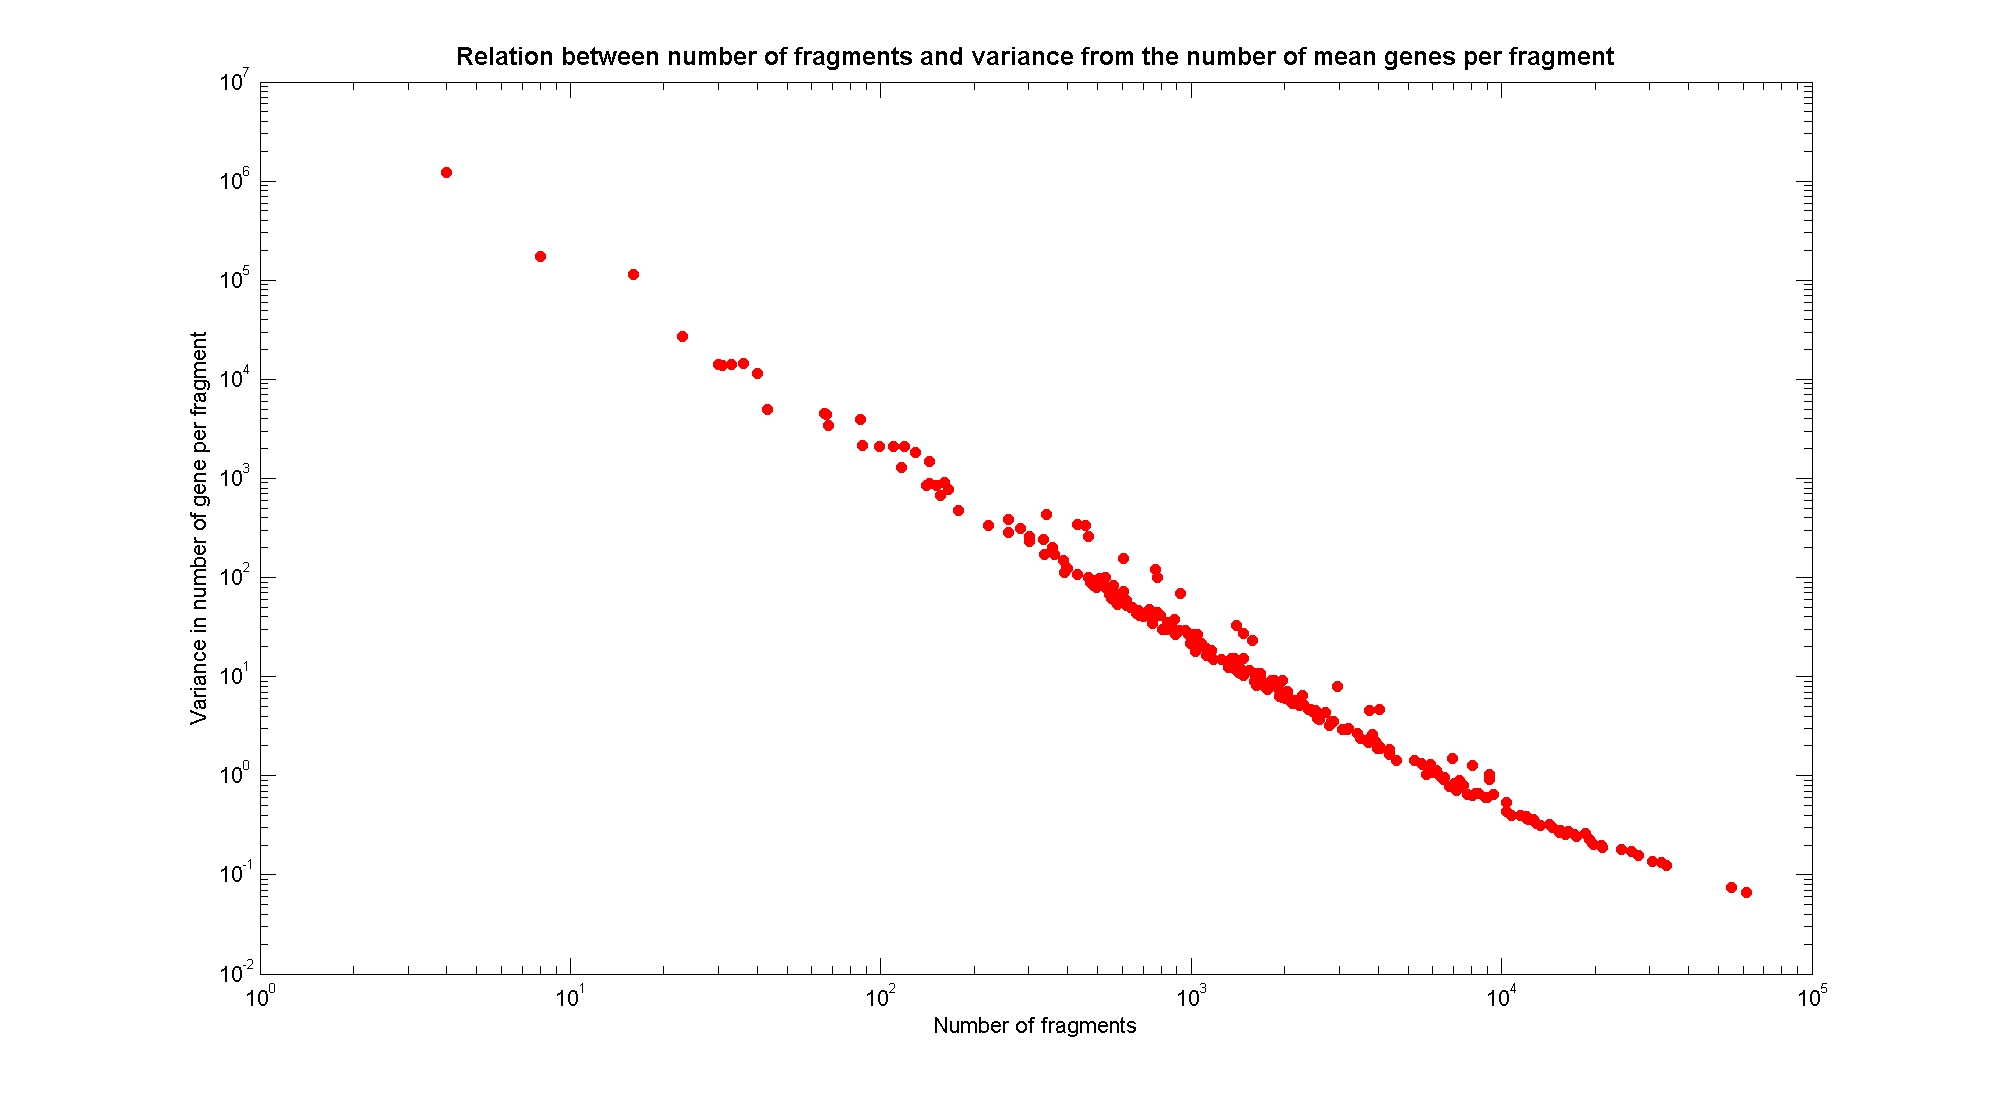
| + | The variance of the number of genes per fragment is well correlated with the number of fragments. | ||
| + | |- | ||
| + | | valign="top" align="center" width="450"| | ||
| + | [[Image:varFragVsVarGenes.jpg|center|900px|]] | ||
| + | <div style="text-align:justify;"> | ||
| + | </div> | ||
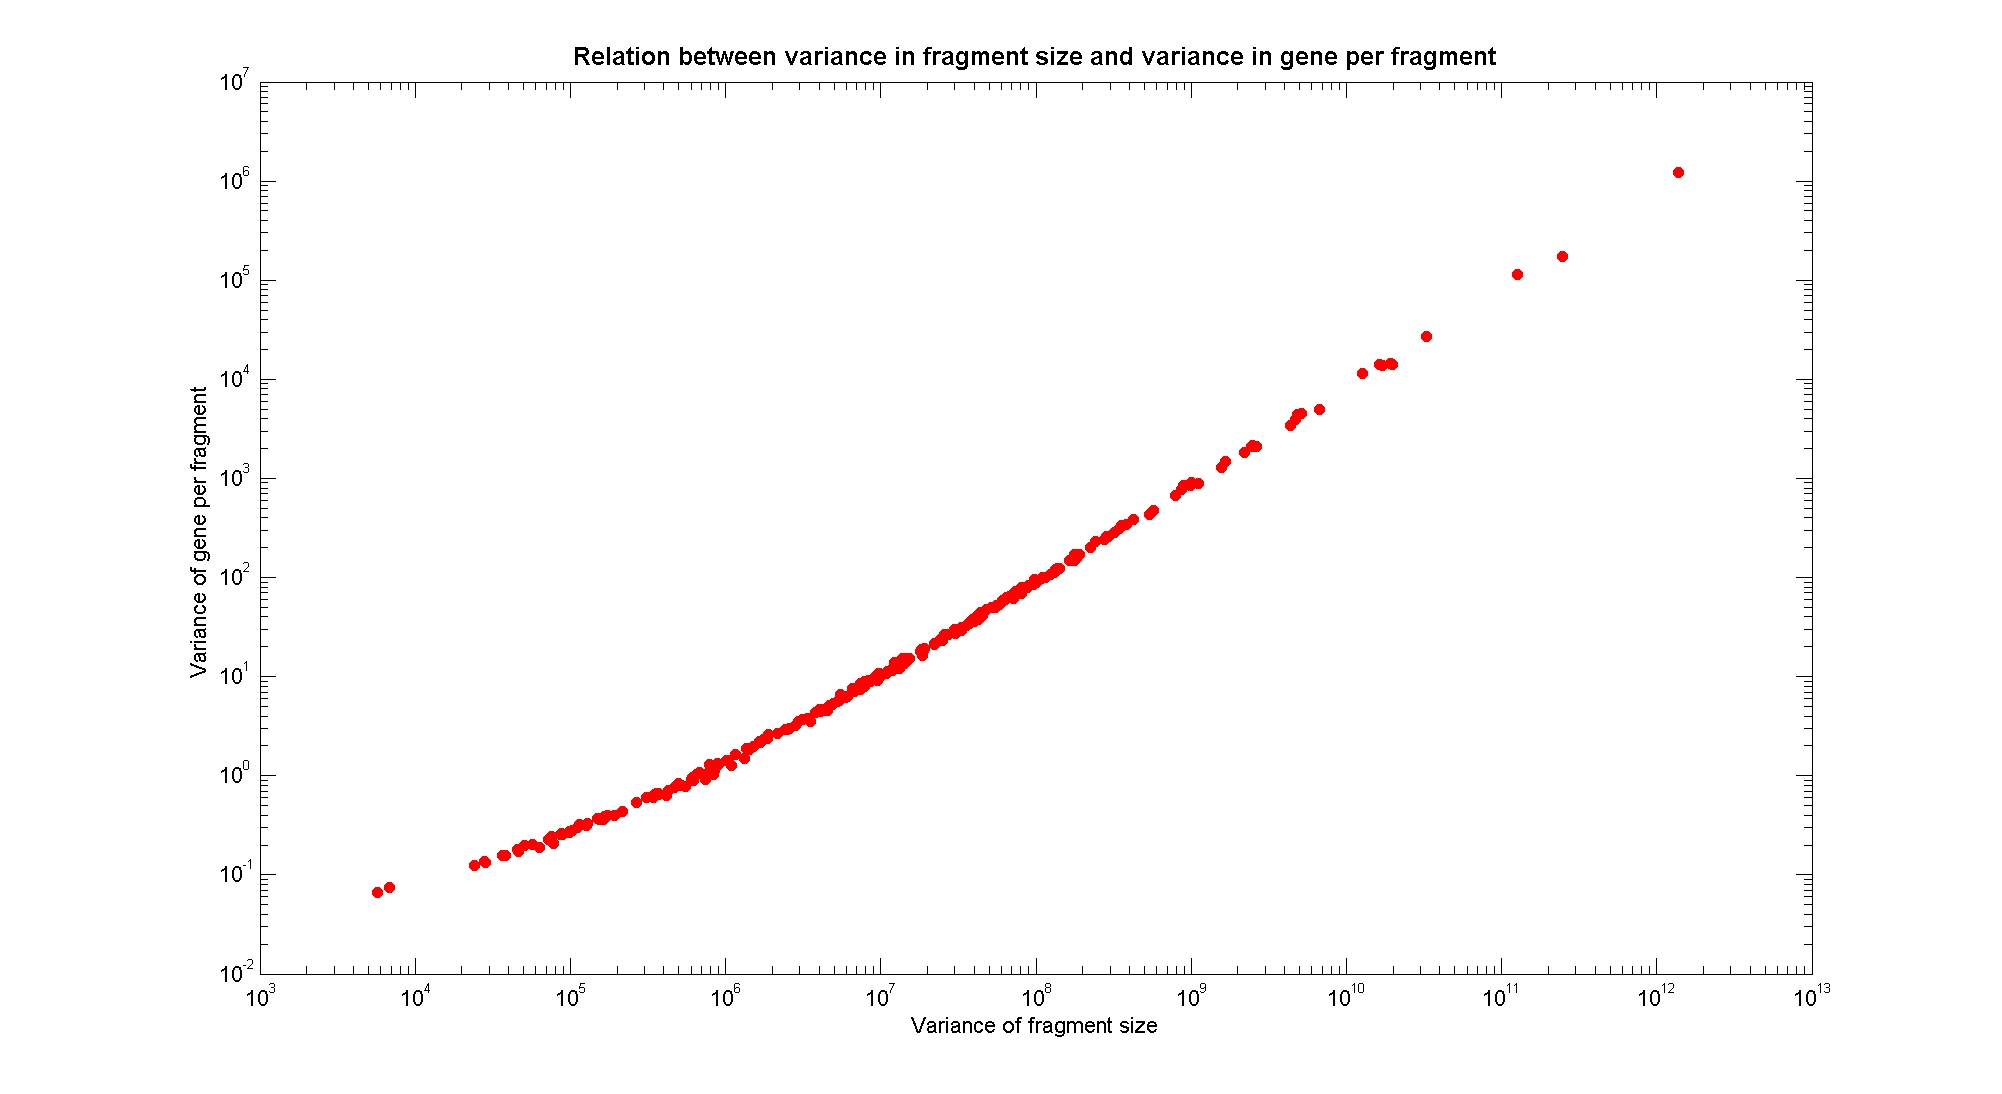
| + | The variance in fragments size is linearly correlated in a log-log plot with the variance in genes per fragment. | ||
| + | |- | ||
| + | | valign="top" align="center" width="450"| | ||
| + | [[Image:numFragmentsVsEssentialGene.jpg|center|900px|]] | ||
| + | <div style="text-align:justify;"> | ||
| + | </div> | ||
| + | The probability of each fragment to contain an essential gene gives us a criteria to understand the level of mortality of a particular fragmentation pattern. This relation also is determined by the frequency of cutting. | ||
| + | Essential genes are genes that were discovered to be lethal in a single knockout experiment. The list of essential genes we use has been taken from (1). | ||
| + | |} | ||
| + | <br> | ||
| + | To conclude, we can state that based on the static analysis it is not possible to discriminate optimal restriction enzymes. It is evident that known (essential) genes on the chromosome are randomly distributed as well as the cutting sites of restriction enzymes. Our choice of the restriction enzyme to be used should then be based only on the frequency of cutting and related issues, such as the efficiency of cutting and on the genome scale model results. | ||
| + | |||
| + | === Result table on chromosomal digestion simulations === | ||
| + | |||
| + | Using our digestion simulation code (that can be downloaded from our download page) we produced a table with the statistic data for each and all the restriction enzyme. The complete table can be consulted [[Team:ETH_Zurich/Modeling/Genome_Static_Analysis/RestrictionTable|here]]. | ||
| - | === | + | === References === |
| - | + | (1) ''"Experimental Determination and System-Level Analysis of Essential Genes in E. coli MG1655"'', Gerdes et al.,''Journal of Bacteriology'', 2003 | |
| - | + | ||
| - | + | (2) ''"REBASE: restriction enzymes and methyltransferases"'', Richard J. Roberts, Tamas Vincze, Janos Posfai, and Dana Macelis, ''Nucleic Acids Res.'' 2003 January 1; 31(1): 418–420. | |
Latest revision as of 05:21, 30 October 2008
Restriction Enzyme AnalysisThis section presents the computational investigation we performed in order to understand which restriction enzymes cut the genome in fragments that most probably will lead to find the minimal genome in our reduction approach. It is important to note that this is a "statical" analysis: we do not include in the evaluation of the restriction enzyme optimality any prevision regarding the effects cutting patterns can have on cell physiology or cell system behavior. We address questions regarding the cell system response after genome reduction using more advanced modeling techniques (a genome scale model) in the Genome Scale Analysis section. We focus here only on the insights that can be obtained using three kinds of "statical" information:
Using computational tools and the above mentioned information we are interested in asking (and answering) the following questions:
Available restriction enzymes and digestion simulationAs source for the restriction enzyme to consider, we used the [http://rebase.neb.com/rebase/rebase.html REBASE database] (2). We found 713 restriction enzymes that spawn from 4 up to 13 cutters, some with complete specific recognition sites and some with unspecific site properties. Since some of the restriction enzymes present the same recognition site sequence, we grouped them together as a single entity to be tested (216 groups). We downloaded the genome and annotation information regarding E.Coli K12 MG1655 from the GenBank® database. We then simulated the digestion of E.Coli chromosome sequentially for each group of restriction enzymes and performed statistical analysis on the fragment patterns obtained. The following pictures summarize the distribution of the available enzymes regarding their frequency of cutting (number of fragments after digestion): It is possible to note that there is a huge number of restriction enzymes that digest the chromosome in few to high number of fragments (up to 10,000 fragments) and relatively fewer which generate a very high number of fragments. Please note that on the x axis, some of the enzyme groups have been omitted because of space problems and only one of each five has been reported. Analysing the gene content of the fragmentsIn order to understand if there are restriction enzymes that have particular properties (for example the ability to target on the same fragments several essential genes, in order to reduce the probability of causing cell death) we performed some statistical analysis, calculating indexes such as: the mean and variance for fragment lengths, the mean and variance for gene numbers per fragment, the probability of one fragment to contain an essential gene. Here we show the graphs obtained by plotting these indexes.
Result table on chromosomal digestion simulationsUsing our digestion simulation code (that can be downloaded from our download page) we produced a table with the statistic data for each and all the restriction enzyme. The complete table can be consulted here. References(1) "Experimental Determination and System-Level Analysis of Essential Genes in E. coli MG1655", Gerdes et al.,Journal of Bacteriology, 2003 (2) "REBASE: restriction enzymes and methyltransferases", Richard J. Roberts, Tamas Vincze, Janos Posfai, and Dana Macelis, Nucleic Acids Res. 2003 January 1; 31(1): 418–420. |
 "
"
