Team:Cambridge/Modeling
From 2008.igem.org
(→Modelling the complete agr-quorum sensing system) |
|||
| (One intermediate revision not shown) | |||
| Line 2: | Line 2: | ||
In the following article, we would like to introduce a model of the agr-QS of ''S.aureus'' to illustrate how a typical QS system works. Furthermore, the model will predict theoretical values for biological parameters (such as the cell density) that will be verified and we will be also be able to predict how the system will behave if we change a number crucial parameters. This can be extremely useful in informing design decision when building a synthetic device. Finally, we would like to use the model in a hypothetical setup (with a second parallel system) in order to investigate how one might be able to succeed at engineering at biological patterning systems. | In the following article, we would like to introduce a model of the agr-QS of ''S.aureus'' to illustrate how a typical QS system works. Furthermore, the model will predict theoretical values for biological parameters (such as the cell density) that will be verified and we will be also be able to predict how the system will behave if we change a number crucial parameters. This can be extremely useful in informing design decision when building a synthetic device. Finally, we would like to use the model in a hypothetical setup (with a second parallel system) in order to investigate how one might be able to succeed at engineering at biological patterning systems. | ||
| + | |||
| + | A .pdf download of this article can be found by clicking here: [https://static.igem.org/mediawiki/2008/f/fa/Cambridge_2008_Modelling.pdf] | ||
| + | |||
=Modelling Bacterial Quorum Sensing Systems - Parameters= | =Modelling Bacterial Quorum Sensing Systems - Parameters= | ||
| Line 100: | Line 103: | ||
[[Image:Math7.png|center]] | [[Image:Math7.png|center]] | ||
| - | and we substitute in the appropriate terms that we arrived at using quasi-steady state assumptions. Remember we took δ=0.05. We solve these equations and plot PoPS output w.r.t. the volumefraction of intracellular space in | + | and we substitute in the appropriate terms that we arrived at using quasi-steady state assumptions. Remember we took δ=0.05. We solve these equations and plot PoPS output w.r.t. the volumefraction of intracellular space in the following figure. In the case of ''S. aureus'', PoPS output drives a virulence gene. |
[[Image:Img5.png|530px|center]] | [[Image:Img5.png|530px|center]] | ||
Latest revision as of 16:49, 28 October 2008
In our iBrain project this year, we are interested in using peptide-based quorum-sensing systems from gram-positive bacteria to create self-organising biological systems. We would like to demonstrate how to engineer multicellular biological systems that are capable of expressing spatial patterns on a bacterial lawn. This means that we would like to see regular patterns of different levels of gene expression (e.g. of GFP). This would be a first step in the direction of engineering multicellular behaviour that will become immensely useful when thinking about further applications such as self-assembling systems responding to electric input and output (e.g. if one uses a gene that increases cellular electric conductivity), such as iBrain.
In the following article, we would like to introduce a model of the agr-QS of S.aureus to illustrate how a typical QS system works. Furthermore, the model will predict theoretical values for biological parameters (such as the cell density) that will be verified and we will be also be able to predict how the system will behave if we change a number crucial parameters. This can be extremely useful in informing design decision when building a synthetic device. Finally, we would like to use the model in a hypothetical setup (with a second parallel system) in order to investigate how one might be able to succeed at engineering at biological patterning systems.
A .pdf download of this article can be found by clicking here: [1]
Contents |
Modelling Bacterial Quorum Sensing Systems - Parameters
Modelling biological systems usually involves finding relations between a great number of variables and parameters. Usually, these systems cannot be solved in an analytical way as one might accomplish with simpler systems. The problem is compounded by the fact that we only have limited knowledge of the specific parameters involved (production rates, decay rates, etc.). For this article, we shall make a number of assumptions:
1) we work with enzyme concentrations [A] etc. and assume enzymes are well-mixed
2) we use standard enzyme kinetics to infer relations between enzyme concentrations
3) and we scale rate parameters relative to a fixed value.
To expand on the last point, we note that all parameters we will be working with denote rates and thus have the same dimensions. Therefore, we can work with scalar values only. Secondly, we can scale these parameters w.r.t one of them: We shall fix the maximum rate of promoter expression at 1 and determine the other parameters in relation to this rate.
For example, basal expression rates must be significantly lower than the maximum rate of promoter expression. In fact, in the agr-QS system from Staphylococcus aureus that we are going to model the p2 promoter seems to exhibit a significant increase[2] upon activation in wild-types. We shall take basal rates of 0.05, implying a 20-fold increase promoter activity translating into even a greater increase in AIP production (which is 50-fold according to Gustaffson[3] who has also modelled part of the agr-system). Furthermore, we assume that all enzymes decay at the same rate of 0.2.
In addition, phosphorylation and enzyme complex formation rates must be significantly higher than protein expression rates. We shall take phosphorylation rates at 50 (and dephosphorylation rates at 5) and enzyme complex formation rates at 20 (deformation rates at 2). The important thing to remember is that these rates are much higher than the previous ones and will thus allow us to use quasi-steady state assumptions in our model. An example of this method can be found here[4]. To some degree, the quasi-steady state assumption allows us to ignore actual parameter values. This comes in quite handy when modelling biological systems.
To summarise, the parameter values we shall be using are:
maximum promoter expression rate - 1,
basal expression rate - β=0.02,
enzyme decay rate - δ=0.2,
enzyme complex formation and deformation rates - c+=20 and c-=2,
enzyme phosphorylation and dephosphorylation rates - p+=50 and p-=5.
The agr-Quorum Sensing System of S.aureus
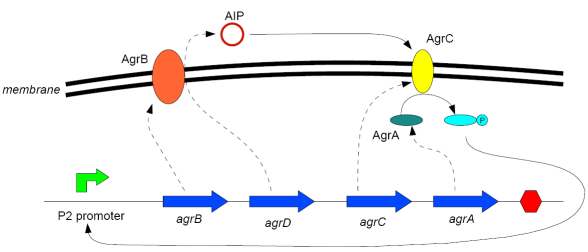
The agr-QS system is a quorum-sensing system in S. aureus and is typical for Gram-positive bacteria. It relies on the signalling peptide AIP (auto-inducing peptide) that is produced by the cell and activates the quorum-sensing system. The QS response is quite tightly regulated as expression occurs only once the local bacterial density passes a fixed threshold value, similar unlike a switch. In a high-density environment the bacteria will exhibit novel behaviour such as virulence or sporulation (both biologically costly but critical and advantageous).
Synthesis Equation
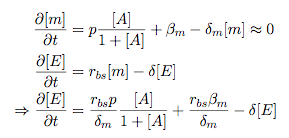
Let us at first look at protein synthesis. The RNA Polymerase binds to the promoter and transcribes mRNA, [m], at a specific rate (assuming Michaelis-Menten kinetics, which we can deduce from simple chemical kinetics theory) depending on the promoter strength and the inducer concentration, [A]. It is then translated at a rate depending on the strength of the ribosome binding site and folds into enzyme [E]. mRNA decay rates are much greater than enzyme decay rates so we can assume that [m] is in a quasi-steady state. The rate equations (after scaling) can be simplified into a single equation (3) as follows:
and further scaling of [E] will leave us with the rate equation,
where p=1 following previous assumptions of maximal promoter expression. By assuming quasi-steady state behaviour, we have gotten rid of the mRNA dynamics. We shall use this synthesis equation in the following sections.
Recasting the agr-receiver part as a biobrick
We would like to have the receiver part of the agr-QS system in form of a biobrick. It becomes useful to think about inputs and outputs to and from such a biobrick. We shall use PoPS as a universal signal to "connect" biobricks to each other. A constitutive promoter biobrick for instance has no inputs but only PoPS output. Our agr-receiver device can be thought of as follows:
In designing the biobrick we use two principles introduced in a recent paper and well-known in iGEM circles[5]: Standardisation and characterisation. Here, our biobrick part is modular in the sense that the "interface" between biobricks consists of PoPS in- and output. In essence, this demonstrates a higher-level analogue to the biobrick restriction site standard that is used in assembling the biobrick parts. We will also look at the output, or transfer function, of the biobrick.
Modelling the agr-quorum sensing response/receiver
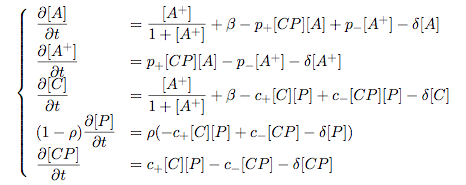
To model and test the agr-receiver, we need to put a p2 promoter (and rbs) upstream of the device we just introduced. Let [P] denote the concentration of AIP, [A] denote the concentration of AgrA and similarly for the other proteins, [CP] denote the obvious enzyme complex and [A+] be AgrA phosphorylated.
We also need to consider concentrations in extra- and intracellular space carefully. AIP exists (or is only a chemical player) in the extracellular environment whereas cell enzymes (such as AgrA and AgrC) exist only within a cell. Assuming that the local density (i.e. the volume fraction) of cells is ρ then 1-ρ will be occupied by AIP with a certain concentration. We assume that concentrations have values relative to extra- or intracellular space i.e. if [A] = 0.2 when ρ=0.1 then doubling intracelullar space to ρ=0.2 while holding the total amount of AgrA constant, will result in [A]=0.1.
The equations of this model read:
Assuming that concentration of [CP] is in a quasi-steady state we arrive at [CP] = c+/(c- + δ} [C] [P] and can substitute it back into the system to simplify it into a 4-component system:
Since A and C are surface enzymes, we can also assume that their levels change much slower than the levels AIP or A+ implying that A and C are in a quasi-steady state. We would then end up with a 2-component system in P and A+ and could easily determine the dynamics of this system (and show that the systems has two stable steady states (low- and high-density behaviour) and an unstable steady state (the 'switch' density). In the following sections we shall, however, only use minimal assumptions and use the 4-component system in modelling only.
Characterising the agr-receiver device
Let us now look at how the receiver behaves under a number of conditions. In all cases, we assume that [P] is held constant (last rate equation would thus fall away).
- In the following, we can observe PoPS output at a fixed point in time while varying AIP levels. This is also called a transfer function (between input and output). Incidentally, PoPS output is identical to PoPS input in this case (both are using the same promoter). The step-like shape of the curve agrees with previously published results[6].
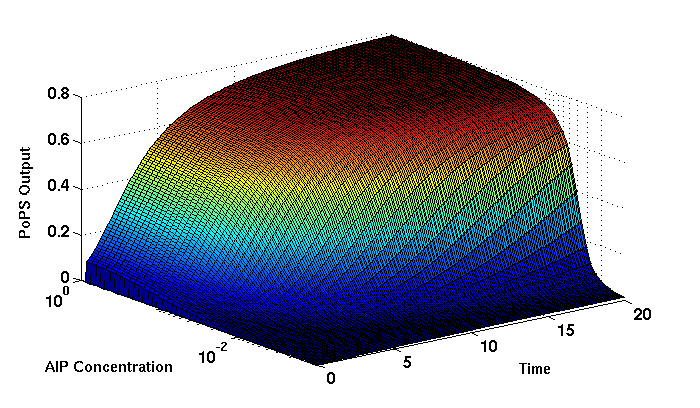
- We can also look at a surface plot of transfer functions, adding an additional time dimension. In this case, we can also clearly see static dynamic performance - PoPS output plotted against time while holding AIP levels constant. This is important in determining the timing of the system output, which can be crucial when using this part in more complex settings.
Throughout the plots we observe step-like behaviour - this is typical for quorum-sensing systems that react sensitively to local cell densities. Our model seems to work. It is interesting to note that even if we change phosphorylation and complex formation rates to different scalar values (we still require them to be large), the transfer function will only change negligibly. No qualitative change is observed.
Modelling the agr-sender device
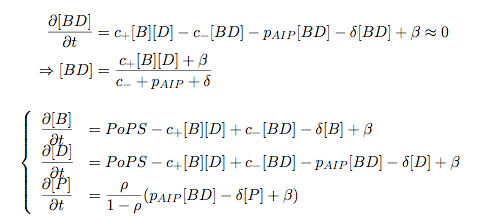
To complete the agr-systems, let us look at the sender that works as follows: AgrB and AgrD lie downstream of a promoter, AgrB is a membrane protein that forms a complex with AgrD and produces AIP. We assume the reaction is B + D <=> BD -> B + P. A corresponding biobrick would consist of agrB and agrD with a terminator and would take PoPS input, but would not generate PoPS ouput since the biobrick would only change AIP levels. Again, we assume quasi-steady state behaviour for BD. The model reads:
where pAIP is the production rate of AIP (we take it to be 1). After substituting BD into the rate equations, we end up with a three-component system again. In the wild-type system, AIP synthesis lies downstream of the p2 promoter (1st figure). There is again a term involving ρ to account for extra- and intracellular medium.
Modelling the complete agr-quorum sensing system
Let us now consider the complete agr-QS system as illustrated in the 1st figure. Clearly, this will be described by solving the equations for the agr-receiver and -sender simultaneously (where PoPS in the sender part will now be the p2 synthesis term from before). The system of equations to be solved will consist of the rate equations of [A]-[D] and [P]. For the rate equation involving [P] we need to add both contributions from the sender and receiver systems and only take a single decay and basal expression term so that the resulting equation reads:
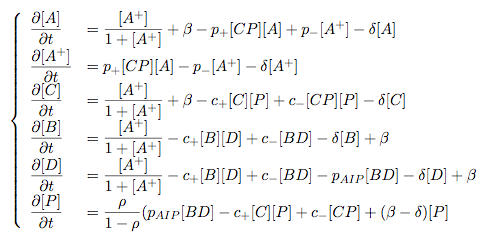
In the lab one can simply\footnote{Biologists will clearly agree with this statement.} put the sender and receiver device downstream of a p2 promoter to recreate the agr-QS system with biobricks. For completeness, the entire model reads:
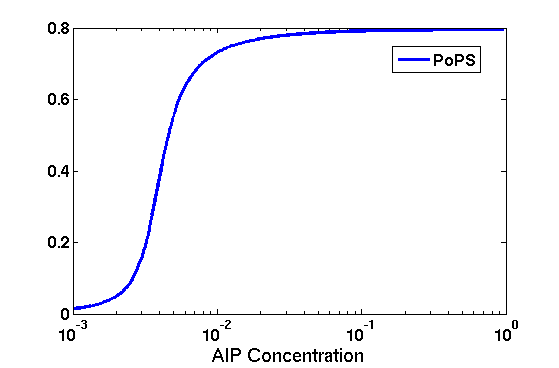
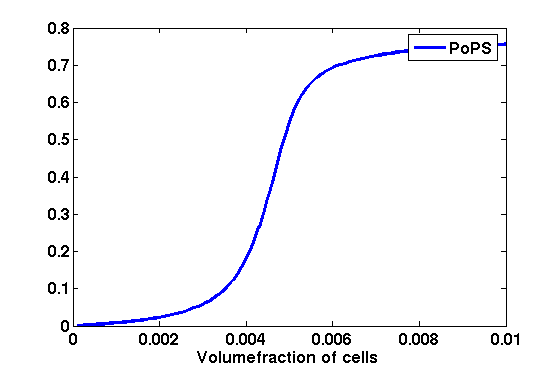
and we substitute in the appropriate terms that we arrived at using quasi-steady state assumptions. Remember we took δ=0.05. We solve these equations and plot PoPS output w.r.t. the volumefraction of intracellular space in the following figure. In the case of S. aureus, PoPS output drives a virulence gene.
While the curve is surprisingly robust when changing initial conditions and most parameters, it is extremely sensitive when varying basal rates of expression (assuming maximum expression is fixed at 1). The shape of the curve and particularly the threshold density at which the system switches behaviour, is therefore largely dependent on the basal rate of expression. The QS-system switches from low- into high-density behaviour at a local density of roughly 0.005 per unit volume.
While we were not able to find data that would verify this estimate, we can consider the gram-negative E.coli. In ideal conditions, E.coli grows to roughly (2-5) x 109 cells/ml in LB until it reaches stationary phase. Assuming that a single E.coli cell has a volume on the order of 1μm3, the cell density at stationary phase will be on the order of 10-3 per unit volume. Assuming that growth in ideal conditions implies higher resulting cell densities, this number will be an upper limit to cell densities, and the E.coli-QS system must be activated at roughly those densities (or slightly below). This validates that our guess of 5x10⁻³ is in the correct order of magnitude.
Finally, it is interesting to note that we have arrived at this result by purely theoretical considerations. We have seen that the basal rate of expression plays a critical role in the system response. This in turn will be useful in informing possible design choices for engineered applications: To change the threshold density one can simply increase basal rates of expression, e.g. by constitutively expressing the agr-system in parallel to the agr-genes that are regulated by plux. As an example, if one was to increase basal expression rates (i.e. β) the threshold value would decrease. This makes it extremely interesting to engineered applications in Synthetic Biology.
Pattern formation
Is it possible to engineer bacteria that exhibit multicellular behaviour and can express spatial patterns (e.g. on a bacterial lawn)?
We would like to use AIP quorum-sensing systems to demonstrate how this might be accomplished. AIP-based quorum-sensing systems have the advantage that there exist numerous derivatives in gram-positive bacteria that are mutually exclusive. This stands in constrast with OHL-based systems (in gram-negative bacteria) that exhibit a high occurance of interference between OHL derivatives.
Before we try to model such behaviour, let us look at a simple mathematical model for pattern formation.
Reaction-diffusion systems
The theory of patterns is vast and it would (and does) extend beyond the scope of this project. However, we will look at a very simple mathematical system that is capable of generating patterns. This might give us some intuition in how patterns are formed even though in our case there might be no direct application.
Turing Patterns Turing's idea was to look at systems in the absence of diffusion. He required such a system to have a stable steady-state and upon addition of diffusion, required this to become unstable. A simple example is the Schnakenberg system that is analysed in Mathematical Biology by J. Murray.
This is a simple system that is capable of creating diffusion-driven patterns. The mathematical analysis goes as follows: One considers the system in the absence of diffusion and looks for a stable steady-state. Next, one considers the same system with the diffusion term added and substitutes in a trial solution that is composed of a Fourier series while requiring the steady-state to be unstable. This will result in a number of further conditions (inequalities) and it is easy to find the (Turing) space of parameters that will satisfy all conditions for pattern generation. A gallery of patterns produced by Schnakenberg system can be found on the next page.
We can see that the type of patterns created is highly dependent on our parameter values, particularly α and β. Can we arrive at similiar patterns with our AIP-QS system?
Pattern formation in Synthetic Biology
How can we enginner bacteria to express spatial patterns? (It is interesting to note that many bacteria do form patterns, particularly when exposed to different nutrient levels) We would like to express patterns on a bacterial lawn with constant bacterial density everywhere and we can think of patterns as spatial distributions of PoPS output (downstream of which we can put GFP) or cell differentiation. Since we have modelled the agr-system and know that non-interfering AIP-based systems exist, we would like to construct a pattern generating system as follows: Both the AIP-A and AIP-B systems inhibit production of the "competitor" molecule. Furthermore, both systems are self-activating. This would be a more complex analogue to the simple reaction-diffusion system introduced previously.
In the following part, we assume that nutrients are abundant (we do not model nutrient consumption) and that the bacterial density throughout the lawn is constant and high by setting ρ=0.01. Note that we are disregarding the fact that these bacteria now live on a 2d surface. We would arrive at a more detailed estimate for bacterial densities in a bacterial lawn if we introduced a diffusion term to account for signalling molecules diffusing across the nutrient layer.
Furthermore, the synthesis terms in this model are bounded in our system. Meinhardt mentioned[7] stripe-like patterns can be generated by such systems where activator production is bounded. While he was analysing a simple two-component system, we would like to generate patterns by using two agr-systems in parallel, acting as activator and inhibitor respectively.
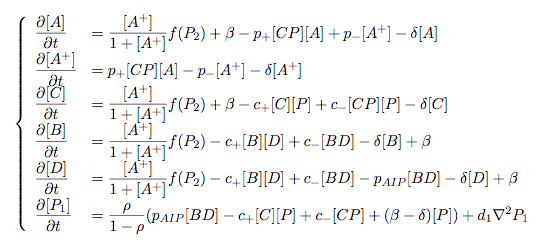
The rate equations for one of the parallel agr-systems (with peptide P1) read as follows:
where f(x)=40/(0.1+x). The equations for the the second agr-derivative system with peptide P2 read analogously with P1 and P2 interchanged (and independent variables for intracellular enzymes). Note that we have added a diffusion term to account for spatial diffusion across the plane.
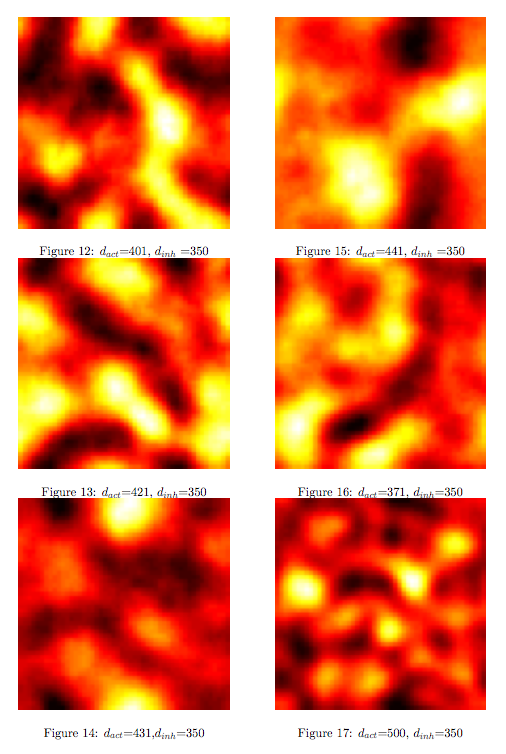
Solving those equations with random initial conditions in levels of Pi gives us:
Some regularity in the patches of differentiation can be observed although these "patterns" depend to a greater degree on initial conditions compared to the patterns seen previously in the Schnakenberg system. However, this is a promising indicator that demonstrates how coordinated multicellular behaviour might originate from an engineered system.
Further Questions
A concise model
We have just tried to go from intra- to intercellular behaviour by naively applying the primarily intracellular agr-QS model to the intercellular case. We cannot say how accurate this approach is since we did not run experiments. However, we can consider a more concise and simpler version of our pattern-generating system. The most important feature of our envisioned systems is that both "populations" inhibit or compete against each other and that the auto-synthesis term is bounded. Assuming that competion can be modelled by simple mass-action, a simplified version of our model would read:
Of course, one can also try other systems that incorporate the main features of our system. Further work can be done on the dynamics that these systems exhibit.
Other pattern-generating systems
There is a vast number of pattern-generating systems. While we trying to model two competitively inhibiting populations, patterns might be created by a completely different system. In particular, we are interested in the question how pattern generation might occur using a single signalling molecule only.
Bounded patterns
Patterning is everywhere in biology - one can think of the whole development process as "pattern formation". Here, patterns generation is switched on by higher-level mechanisms and patterns are expressed in bounded domains (e.g. if we regard organs as patterns, these are clearly seperated from other organs). How does this work? How can we generate patterns that are constraint to a domain? Can we engineer a system that might exhibit this kind of behaviour?
References
All equations have been solved numerically with a simple difference method - this method is easy to implement and gives accurate results, even though one must be careful that stability does not become an issue.
- [1] [Novick et al. 1995] Cell density control of staphylococcal virulence mediated by an octapeptide pheromone
- [2] [Gustafsson, 2004] Characterizing the Dynamics of the Quorum-Sensing System in Staphylococcus aureus
- [3] [Dockery et al. 2001] A Mathematical Model for Quorum Sensing in Pseudomonas aeruginosa
- [4] [Canton+Labno, 2008] Refinement and standardization of synthetic biological parts and devices
- [5] [Meinhard, 1992] Rep. Prog. Phys., Pattern formation in biology: a comparison of models and experiments
 "
"
