Team:University of Sheffield/Gosia
From 2008.igem.org
| (3 intermediate revisions not shown) | |||
| Line 58: | Line 58: | ||
[[Image:gp20.jpg|left|460px|15]] | [[Image:gp20.jpg|left|460px|15]] | ||
[[Image:gp21.jpg|right|460px|16]] | [[Image:gp21.jpg|right|460px|16]] | ||
| - | [[Image: | + | [[Image:Kuciakucia.jpg|left|460px|17]] |
[[Image:gp23.jpg|right|460px|18]] | [[Image:gp23.jpg|right|460px|18]] | ||
[[Image:gp24.jpg|left|460px|19]] | [[Image:gp24.jpg|left|460px|19]] | ||
| Line 66: | Line 66: | ||
[[Image:gp28.jpg|left|460px|23]] | [[Image:gp28.jpg|left|460px|23]] | ||
[[Image:gp29.jpg|right|460px|24]] | [[Image:gp29.jpg|right|460px|24]] | ||
| - | [[Image:gp30.jpg| | + | [[Image:gp30.jpg|center|460px|25]] |
| + | |||
| + | '''24/10/08''' | ||
| + | |||
| + | BBs construction continues - a PCR was run to PCR-out genes cqsS, barA and Red Recombinase cassette. A PCR run yesterday by Rosie didn't work in all cases (Illustration 1). | ||
| + | |||
| + | The procedure was carried out in accordance with Protocol [X] except that 1 µl of 100 mM stock solutions of forward and reverse primers were used instead of 2 pm/µl as usually. 10 ng of plasmid pKD46 was added instead of 1 ng. Exact volumes of PCR reaction mixture components is listed in Table 1. | ||
| + | |||
| + | [[Image:tabe1.jpg|center|tabtab]] | ||
| + | |||
| + | |||
| + | |||
| + | PCR of BBs carried out by Rosie yesterday (23/10/08) | ||
| + | |||
| + | |||
| + | |||
| + | [[Image:BBgelli.jpg|left|tabtab]] | ||
| + | [[Image:tttab5.jpg|center|tabtab]] | ||
| + | |||
| + | PCR was successful and yielded bands of predicted size for genes: | ||
| + | *csrA + promoter (1) | ||
| + | *csrA (3) | ||
| + | *csrB + promoter (5) | ||
| + | *csrB (9) | ||
| + | *uvrY + promoter (11) | ||
| + | *uvrY (13) | ||
| + | *cqsA (19) – to be verified | ||
| + | *cqsS (22) | ||
| + | |||
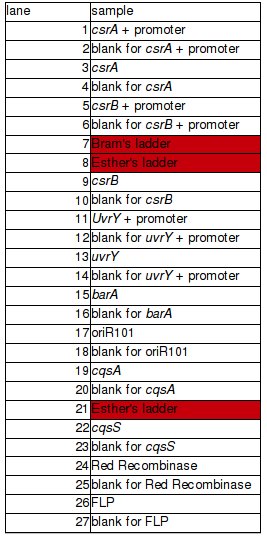
| + | Very bright blobs at the end of the lanes are primers dimers. They are result of excessive volume of primers added to PCR mixture. DNA visible in the blanks for particular genes is a DNA product that dissociated from it's lane to neighbouring one. This is thought so because the bands are the same position but the one is much brighter than the other. Positions of bands in lanes 19 and 20 could indicate a problem – gene was loaded to the lane 19. Band in lane 19 is less bright than the band in lane 20 and they are at different positions. This can be a result of mistake in annotation cos this experiment was carried out in a hurry or something else was multiplied in lane 20. Conclusion is that it's impossible to say for sure if gene from lane 19 is a CqsA or not. | ||
| + | |||
| + | |||
| + | '''25/10/08''' | ||
| + | |||
| + | Plan for preparing BBs for shipment was established and first part of it carried out. BBs genes were purified for further digestion. However cleaned BBs weren't run on the analytical gel to save some time. They will be run tomorrow as digestion will change bands by size that agarose cannot resolve. The size estimated tomorrow will correspond to the size of the PCR products. DNA concentration in a sample was estimated to know how much of it to add to restriction digest mixture. Genes were restriction digested to generate sticky ends for further ligation with plasmid backbone. | ||
| + | |||
| + | Procedure for preparing BBs for shipment is as follows: | ||
| + | |||
| + | * clean a PCR products | ||
| + | * run the cleaned up products on the analytical gel | ||
| + | * check what is the concentration of DNA in a sample | ||
| + | * restriction digest BBs | ||
| + | * clean the digest | ||
| + | * run the analytical gel of the restriction digest | ||
| + | * purify the BB plasmid from the gel [this resolves plasmid backbone and CcdB gene and prevents from | ||
| + | |||
| + | PCR was cleaned with QIAquick PCR purification kit from QIAGEN. Concentration of DNA in a sample was measured with spectrophotometer. Restriction digest was carried out as in the Protocol [X]. Genes were restriction digested with enzymes SpeI and EcoRI from NEB. Buffer used was NEB2 buffer from NEB. List of BBs genes and plasmids digested is given in a Table 1. Exact volumes of components of restriction digest mixture are listed in Table 2. | ||
| + | |||
| + | [[Image:tttab2.jpg|center|tabtab]] | ||
| + | [[Image:tttab3.jpg|center|tabtab]] | ||
| + | |||
| + | Samples containing gen barA and Red Recombinase were probably wrongly annotated – numbers corresponding to the tubes containing them were probably swapped during purification step. Which is which should be known tomorrow after the analytical gel is run. Concentration of those genes in the sample is very similar so digest should be fine in both cases. | ||
| + | |||
| + | Concentration of genes in the sample is given in a Table 3. | ||
| + | |||
| + | [[Image:tttab4.jpg|center|tabtab]] | ||
| + | • because concentration of the cqsS gene were suspiciously high measurement was repeated few times. All readings oscillated around those two values. | ||
| + | Samples were incubated overnight at 37*C (Rose: bright green tube rack). | ||
Latest revision as of 12:41, 29 October 2008
16/08/08
Primers for Kan cassette synthesis ordered.
21/08/08
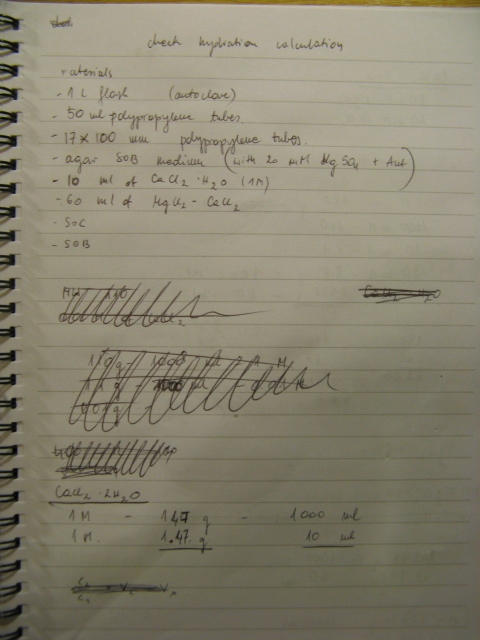
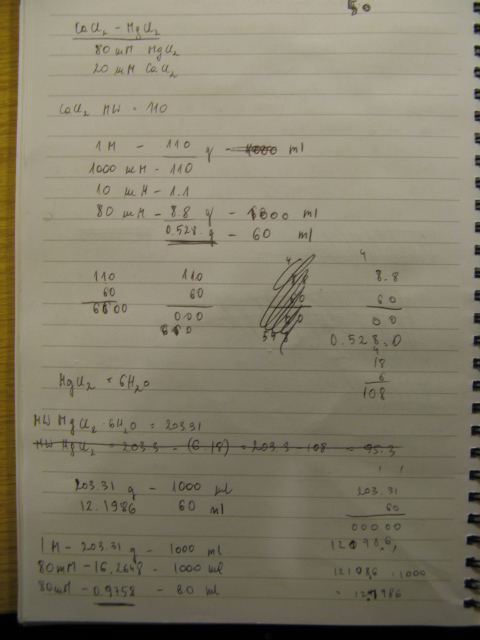
Primers arrive. Rehydration of a primers was carried as follows: volume a dH2O (uL) equal to ten times the number of nanomoles of DNA present in the tube will produce a stock solution at 100µM concentration.
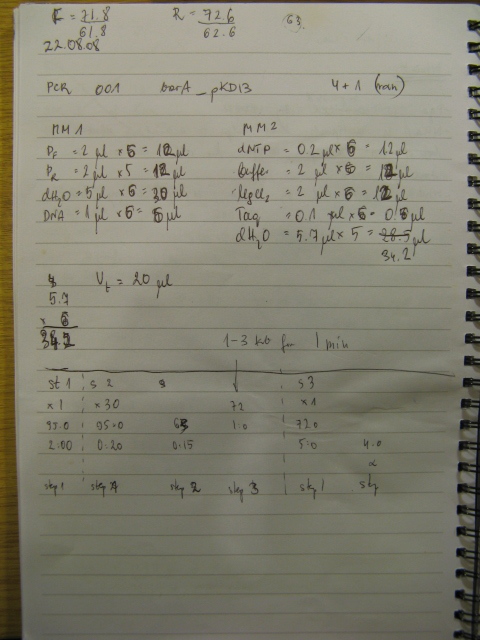
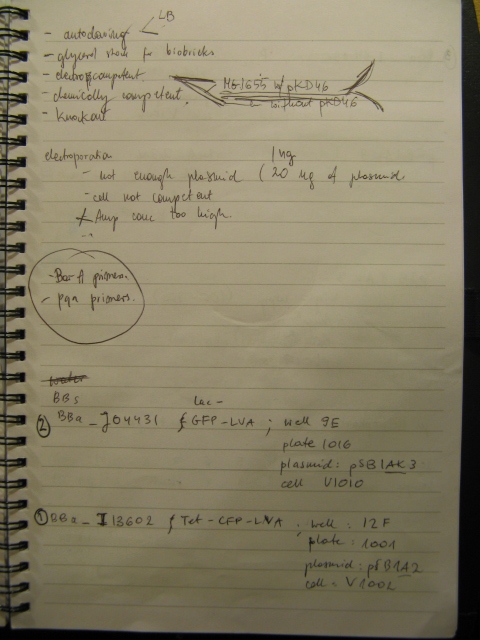
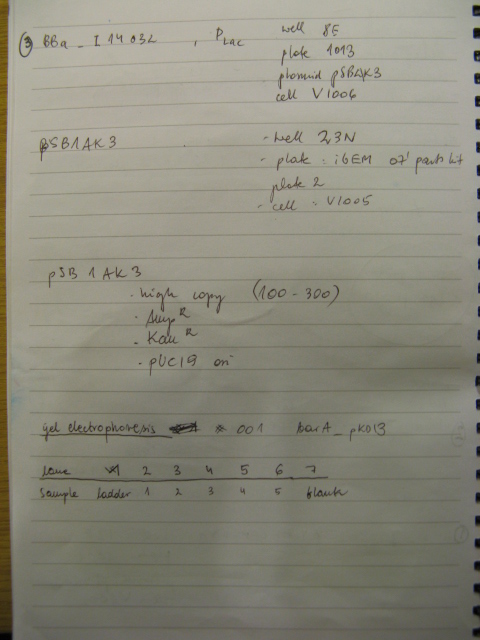
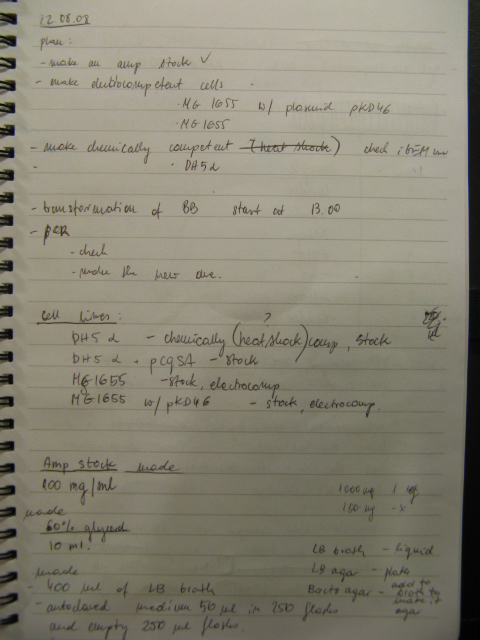
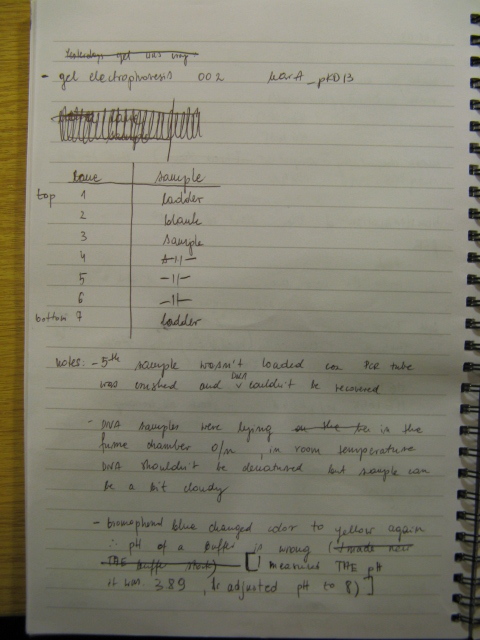
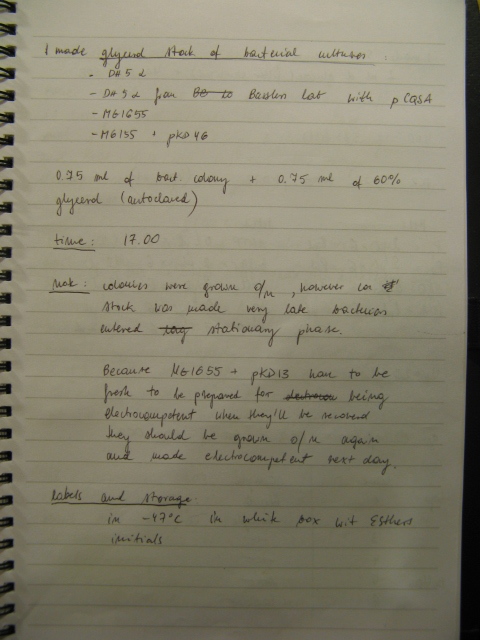
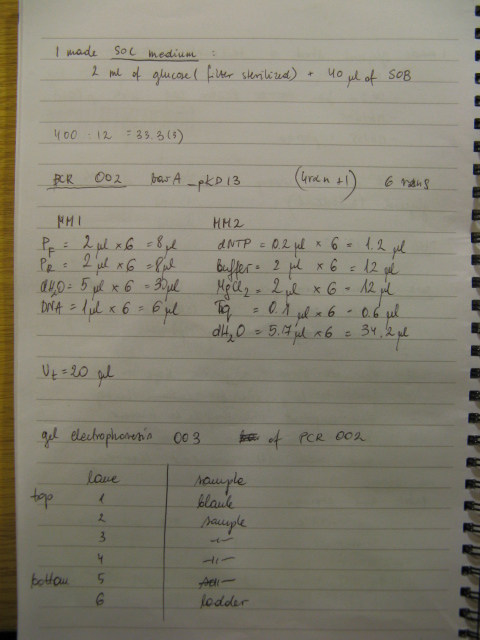
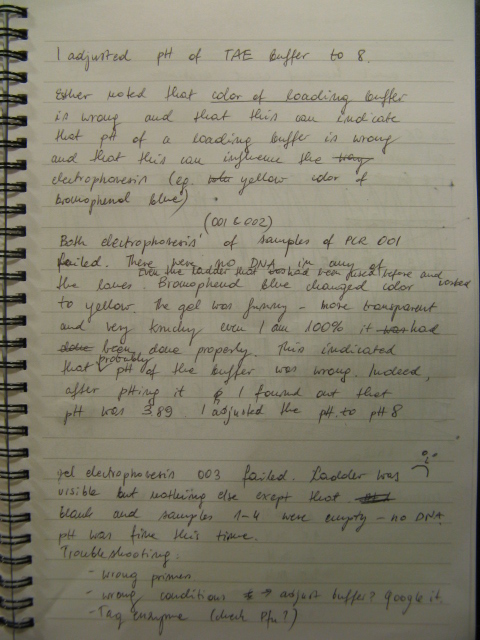
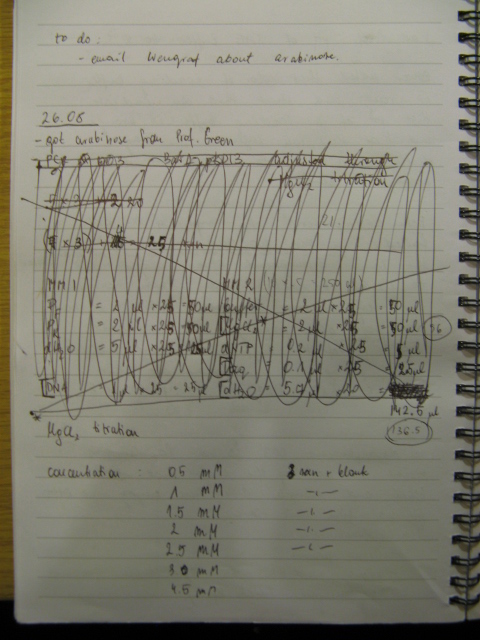
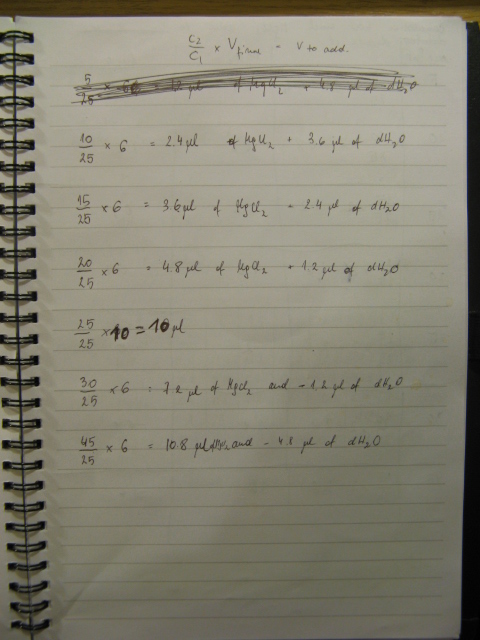
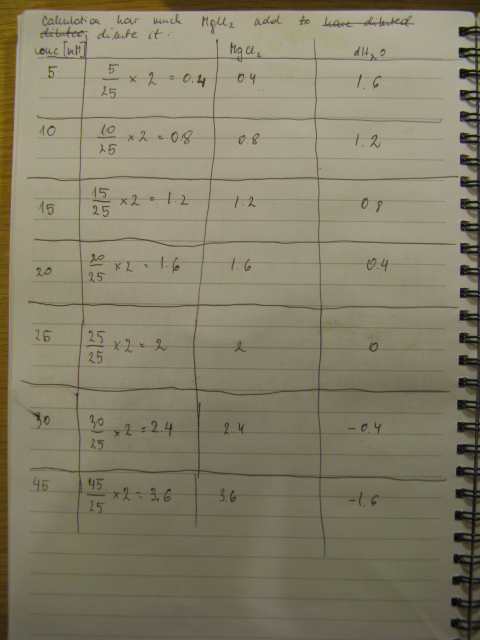
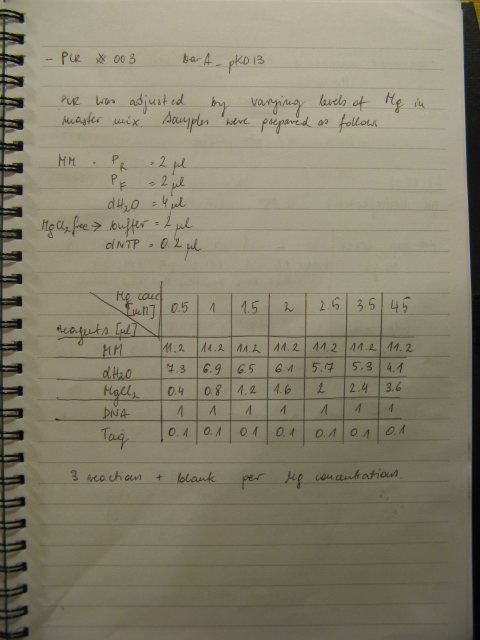
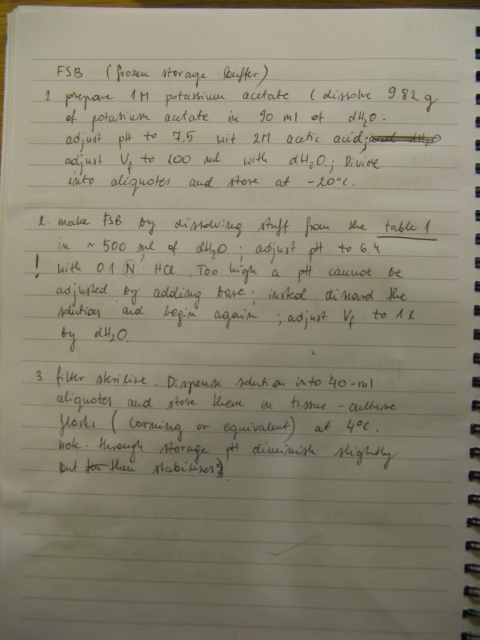
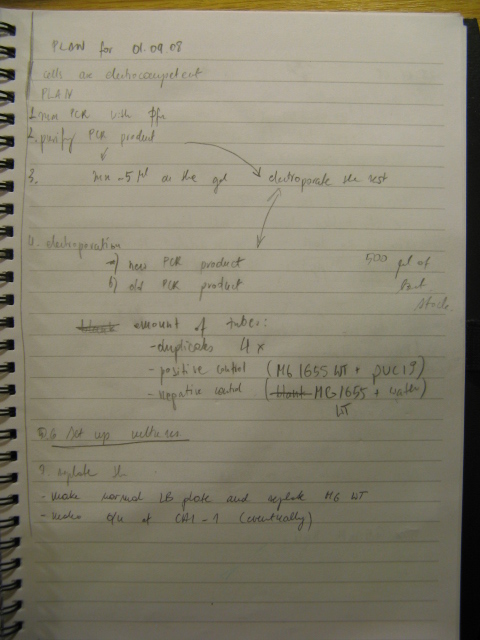
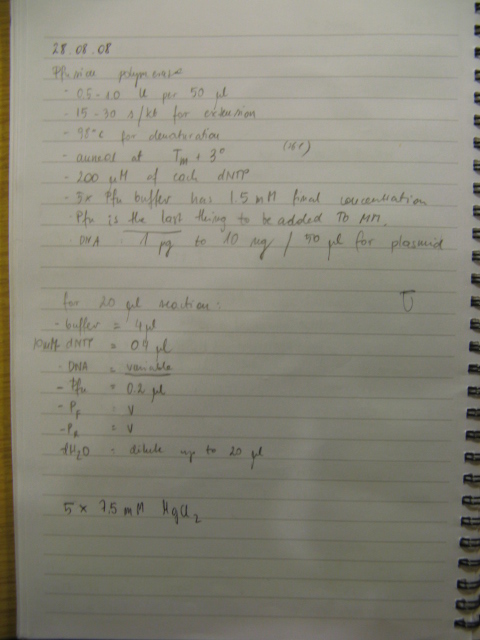
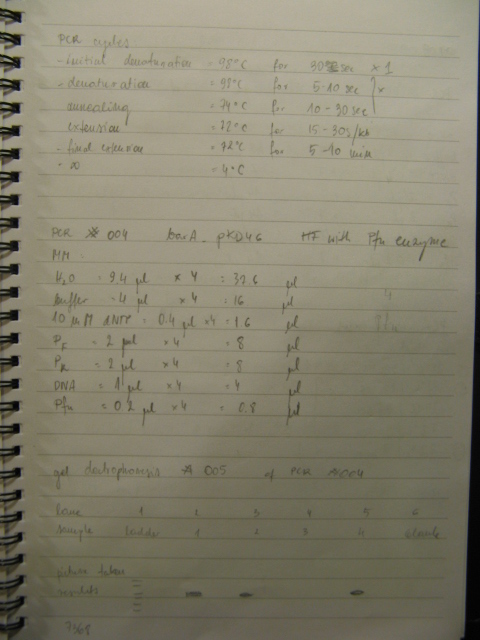
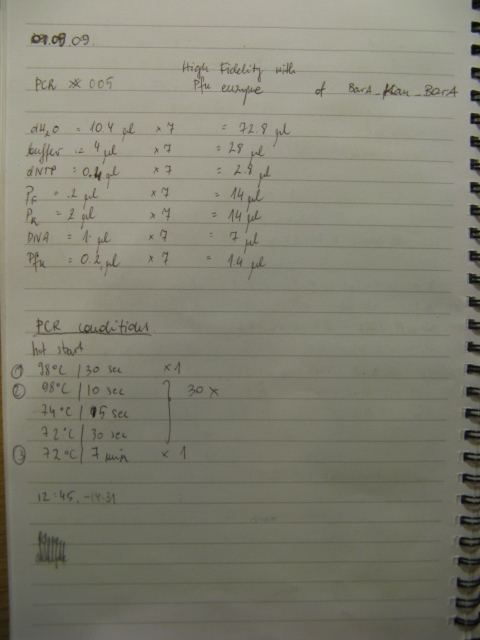
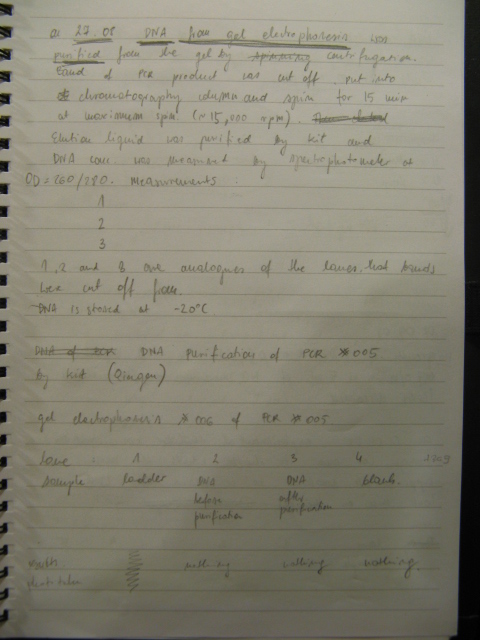
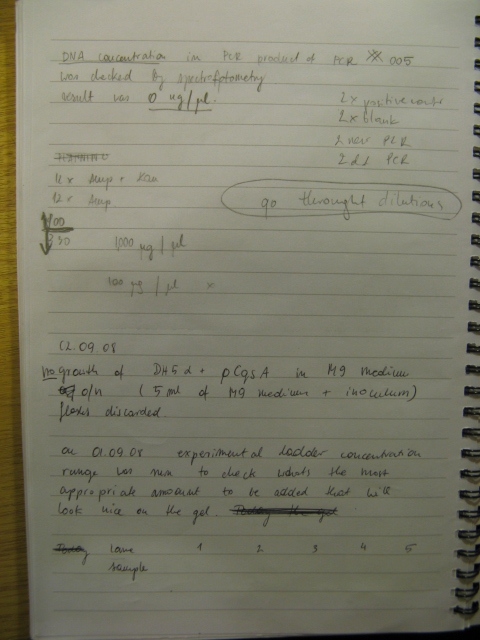
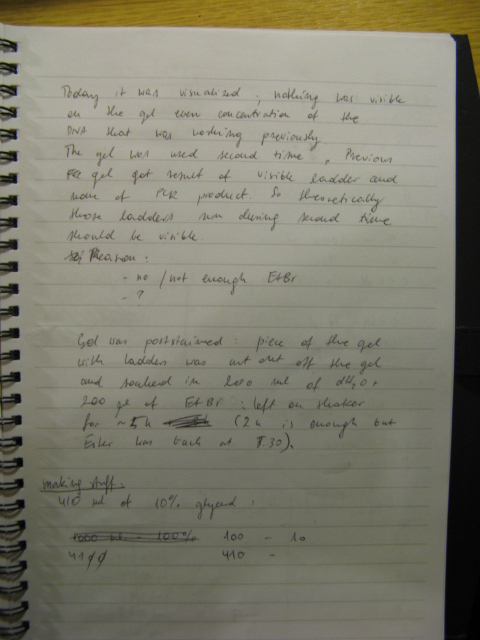
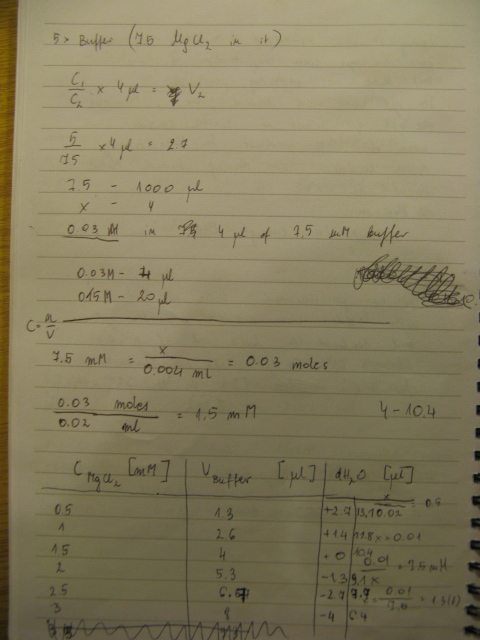
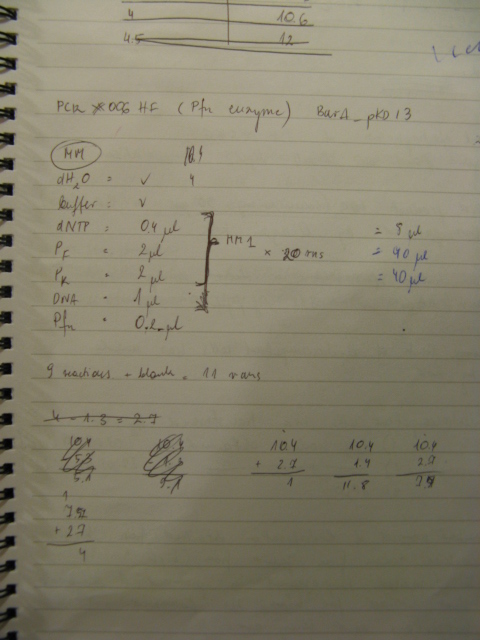
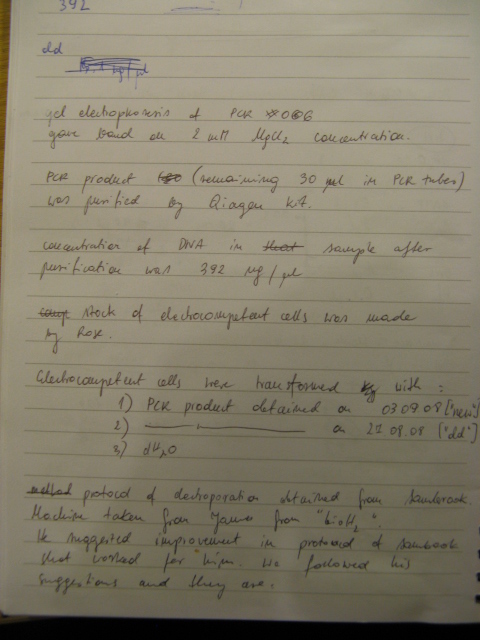
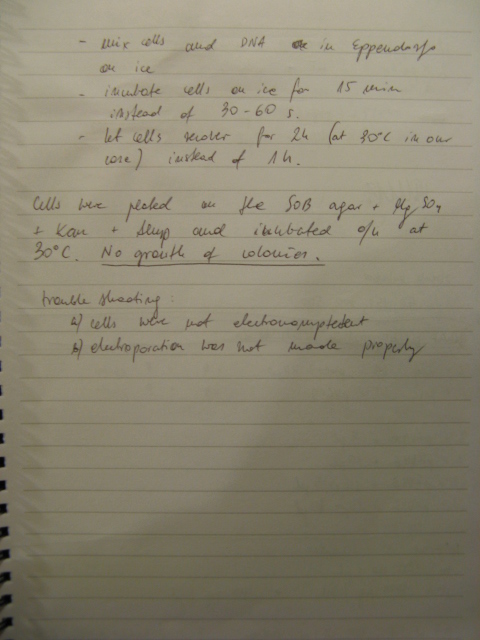
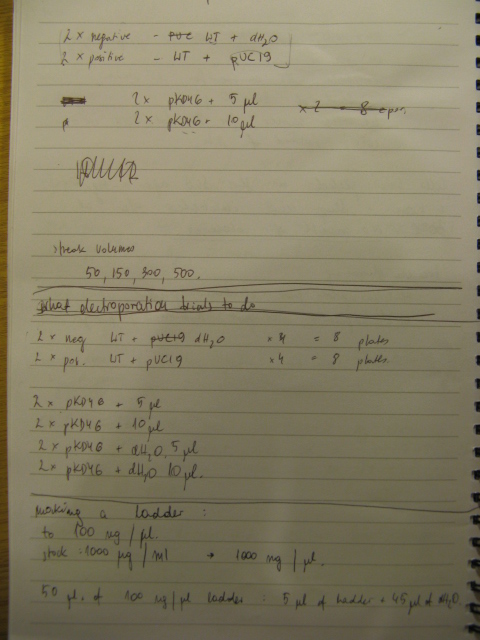
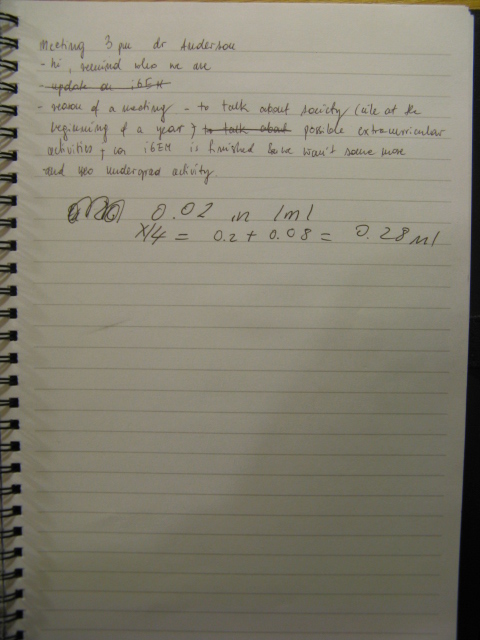
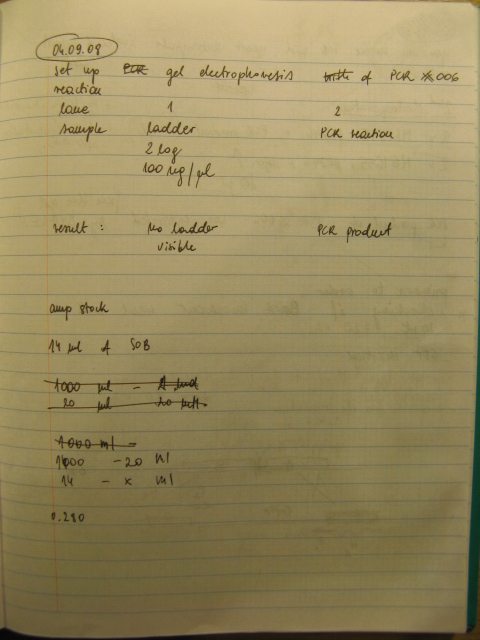
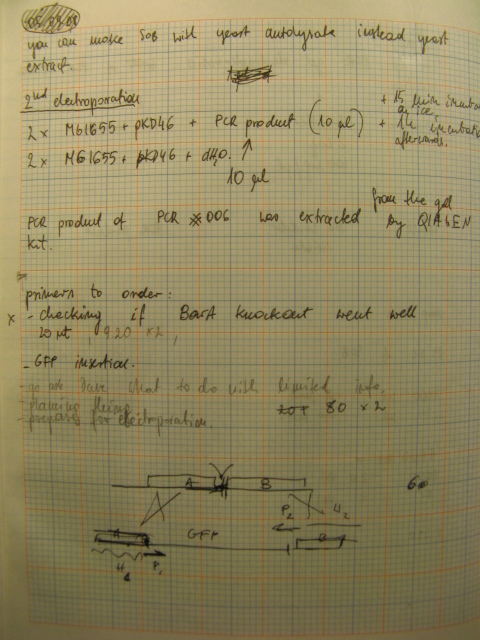
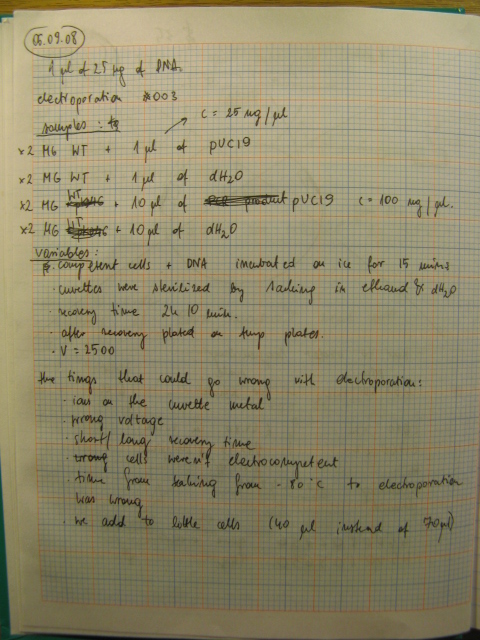
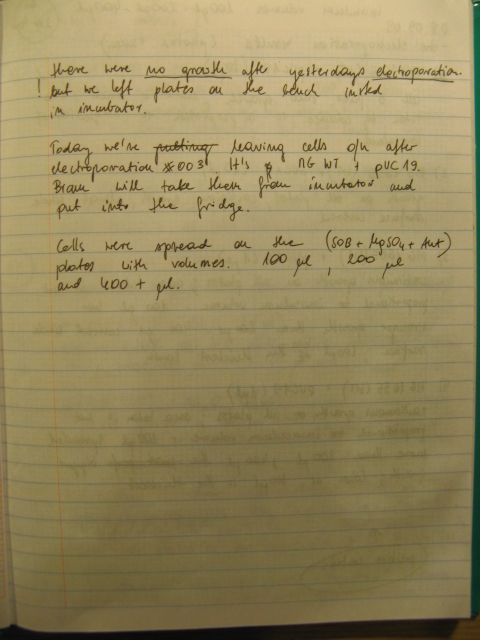
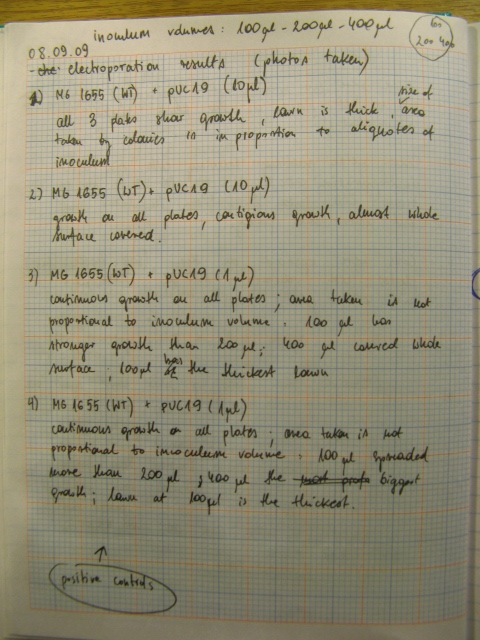
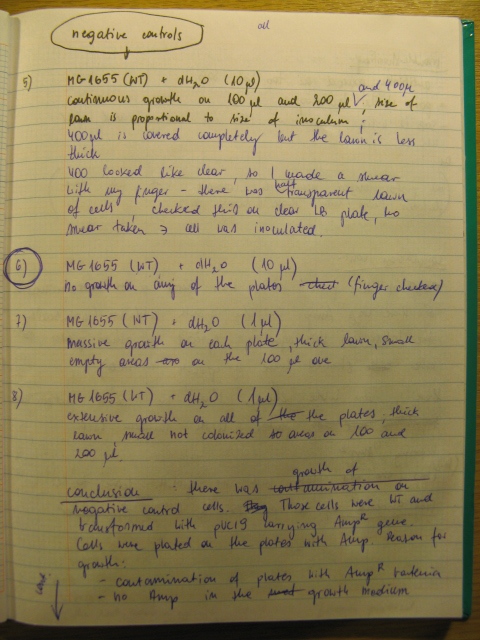
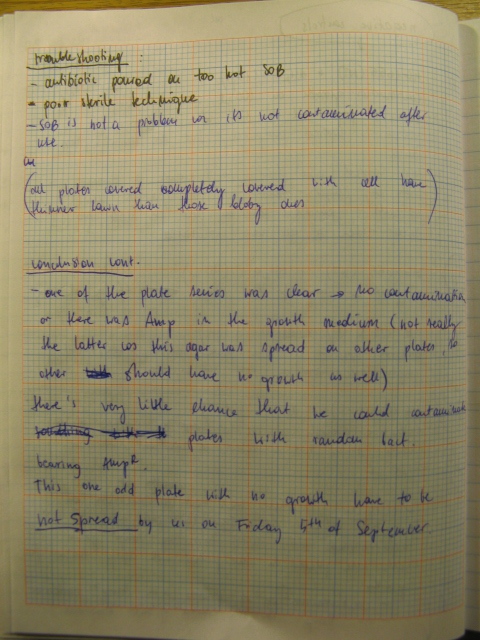
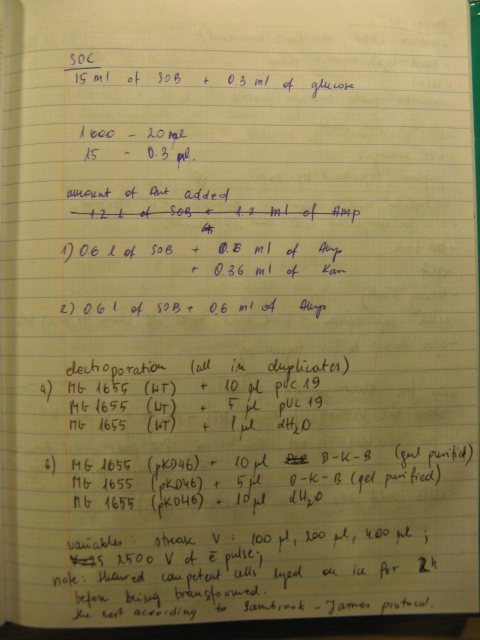
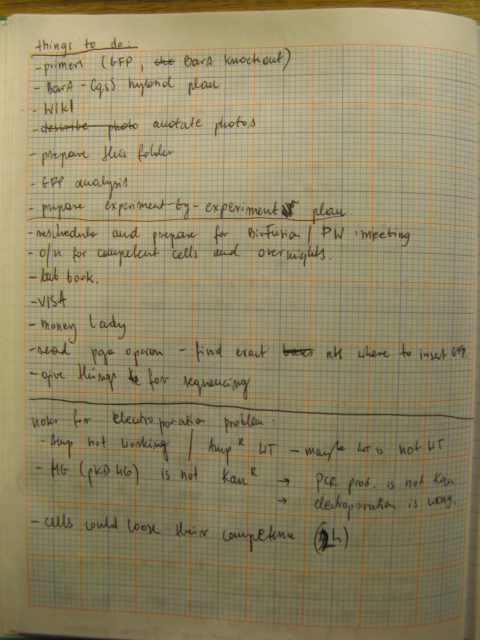
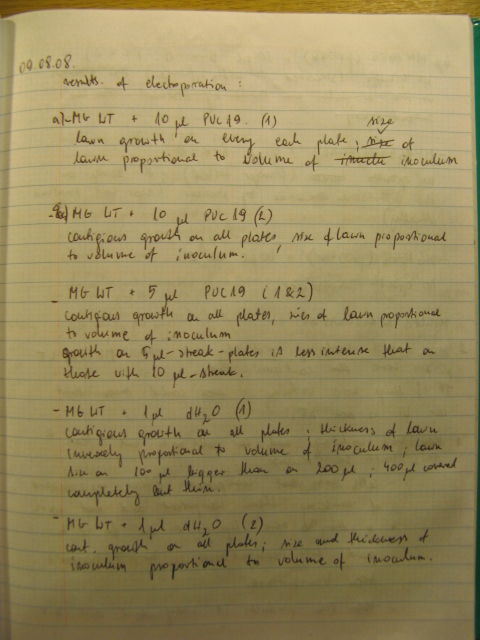
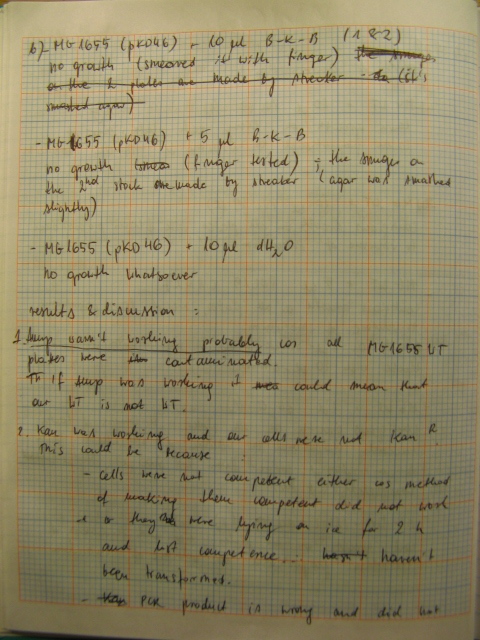
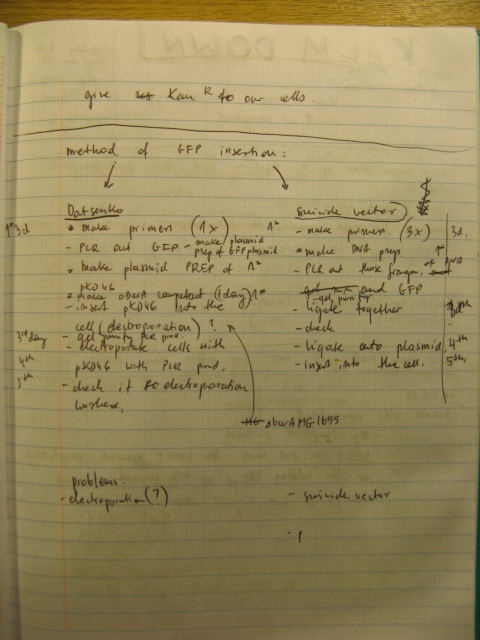
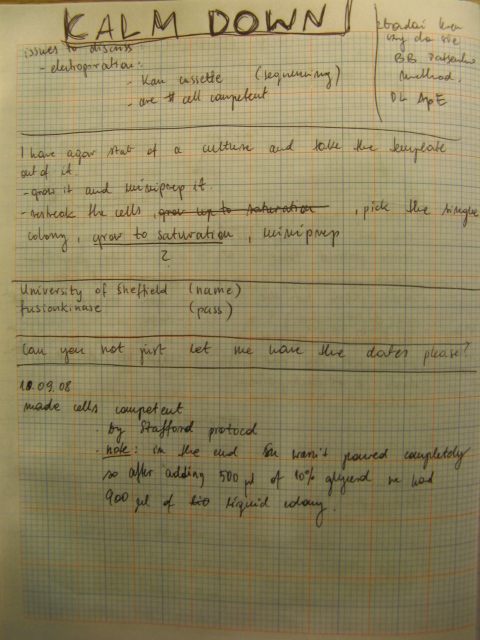
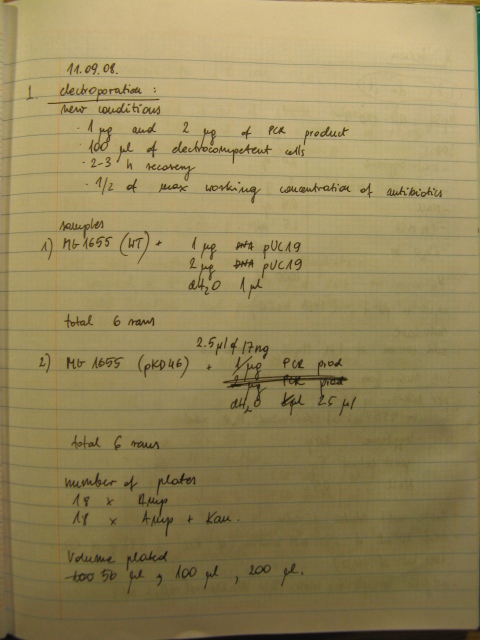
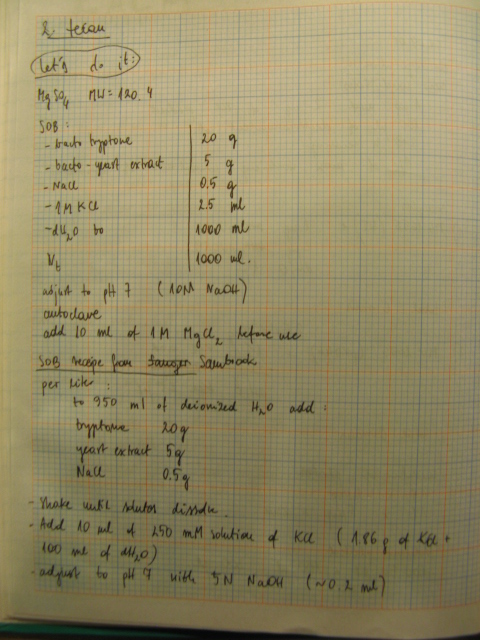
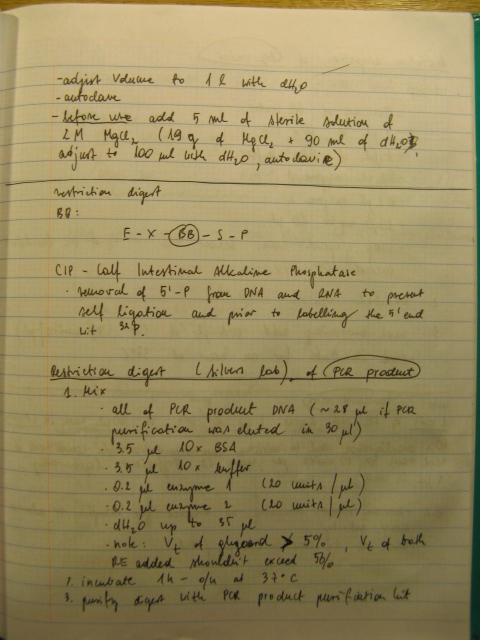
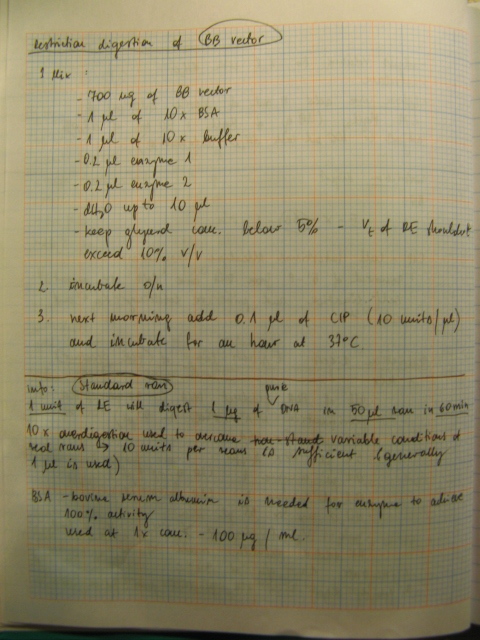
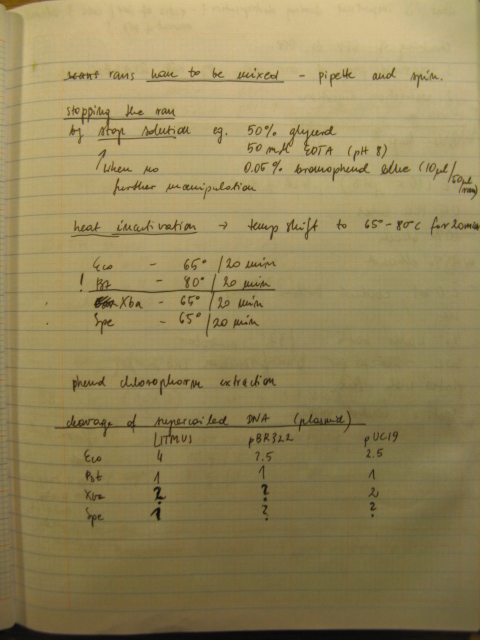
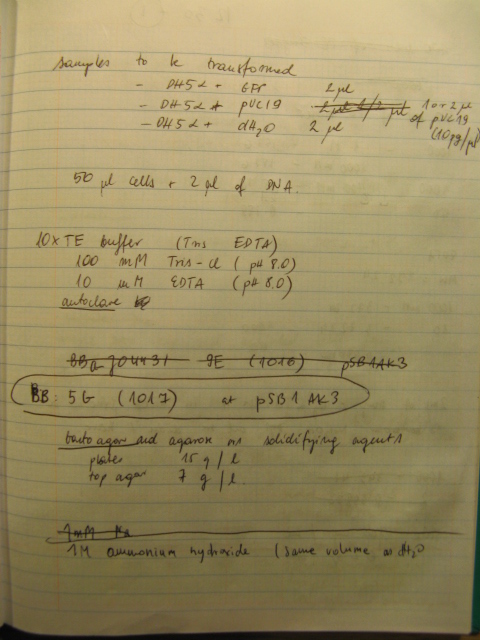
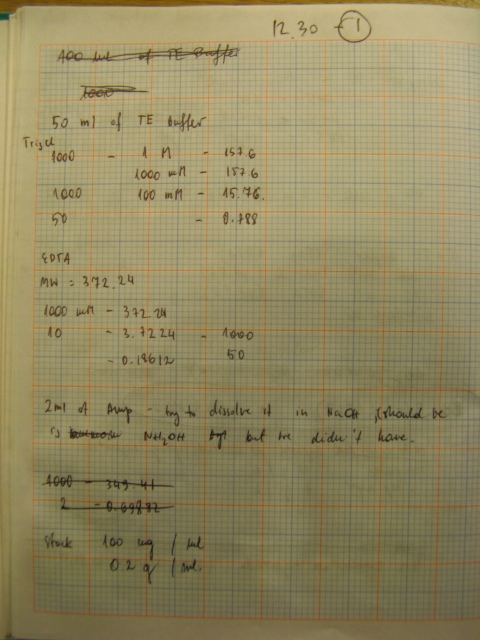
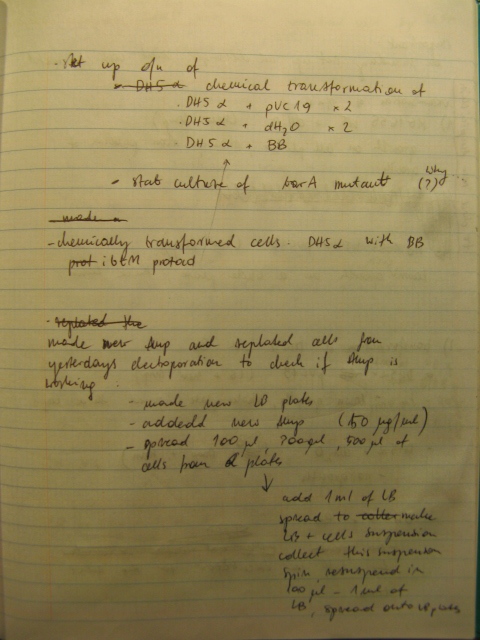
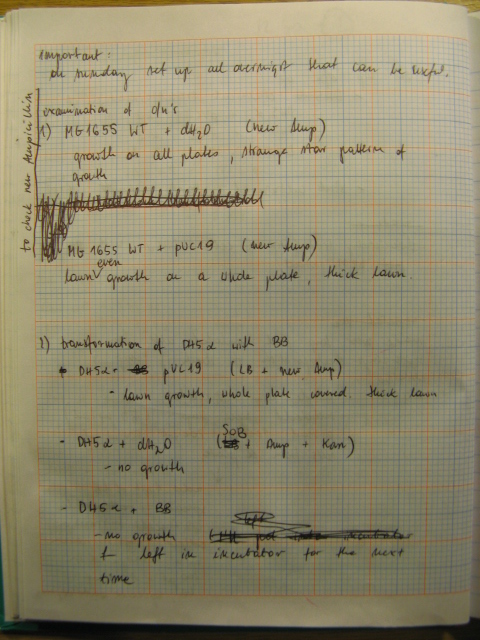
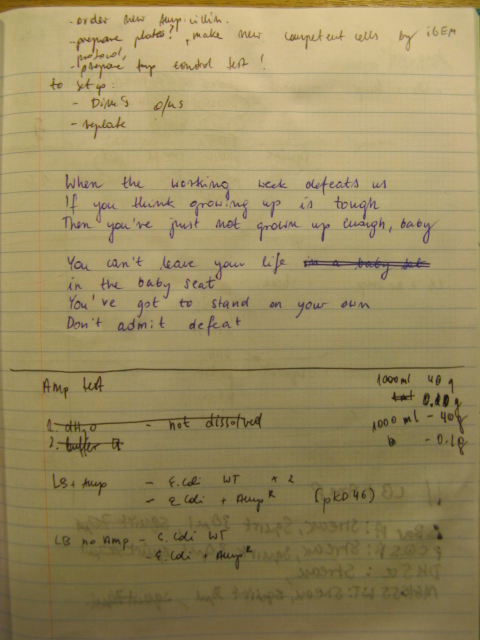
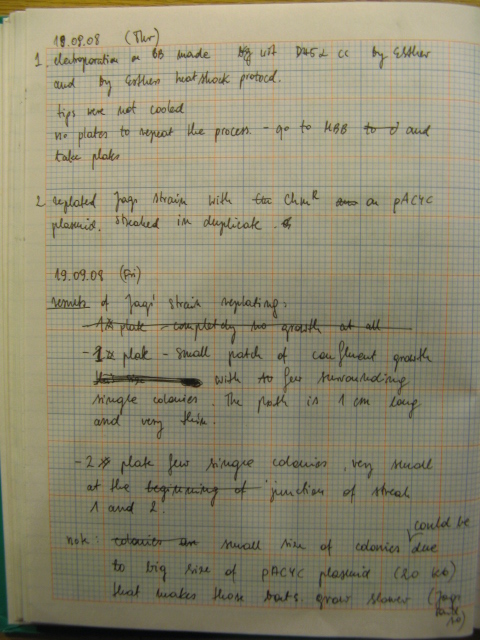
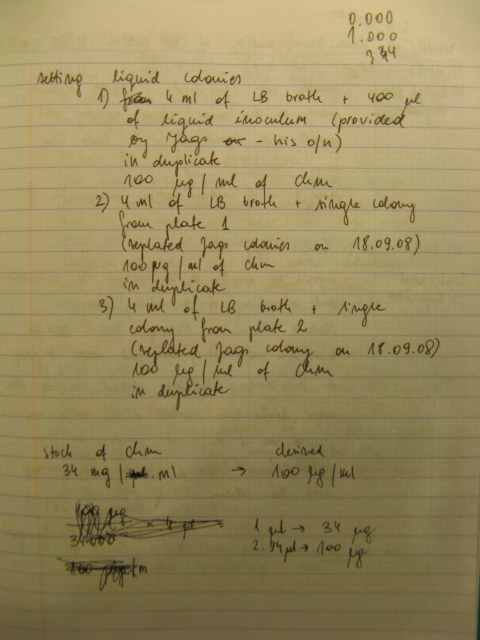
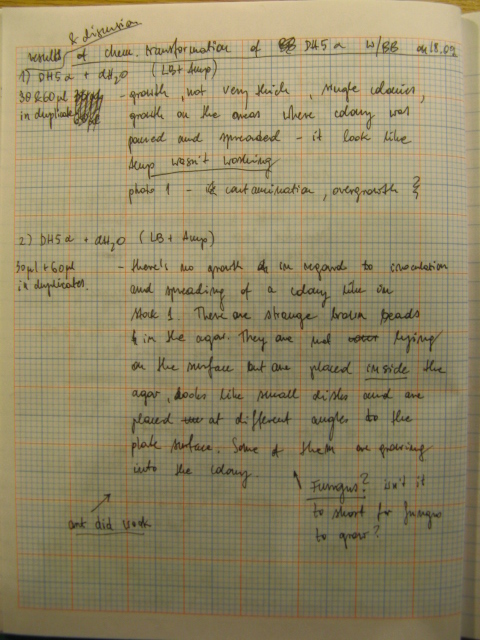
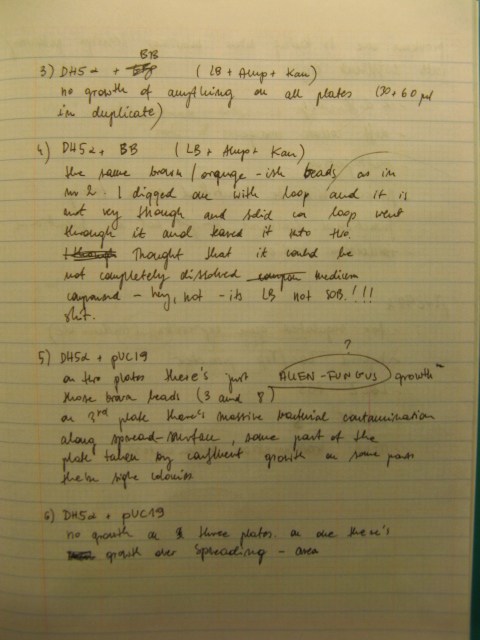
Due to data corruption I do not have an electronic copy of my lab book any more. I am publishing my handwritten notes as an evidence of my work.
24/10/08
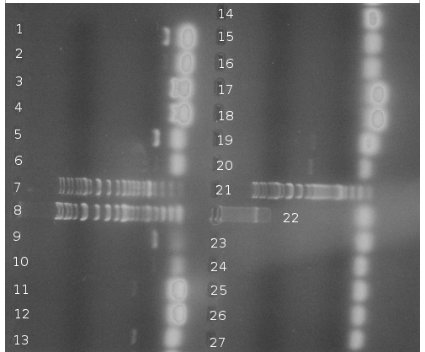
BBs construction continues - a PCR was run to PCR-out genes cqsS, barA and Red Recombinase cassette. A PCR run yesterday by Rosie didn't work in all cases (Illustration 1).
The procedure was carried out in accordance with Protocol [X] except that 1 µl of 100 mM stock solutions of forward and reverse primers were used instead of 2 pm/µl as usually. 10 ng of plasmid pKD46 was added instead of 1 ng. Exact volumes of PCR reaction mixture components is listed in Table 1.
PCR of BBs carried out by Rosie yesterday (23/10/08)
PCR was successful and yielded bands of predicted size for genes:
- csrA + promoter (1)
- csrA (3)
- csrB + promoter (5)
- csrB (9)
- uvrY + promoter (11)
- uvrY (13)
- cqsA (19) – to be verified
- cqsS (22)
Very bright blobs at the end of the lanes are primers dimers. They are result of excessive volume of primers added to PCR mixture. DNA visible in the blanks for particular genes is a DNA product that dissociated from it's lane to neighbouring one. This is thought so because the bands are the same position but the one is much brighter than the other. Positions of bands in lanes 19 and 20 could indicate a problem – gene was loaded to the lane 19. Band in lane 19 is less bright than the band in lane 20 and they are at different positions. This can be a result of mistake in annotation cos this experiment was carried out in a hurry or something else was multiplied in lane 20. Conclusion is that it's impossible to say for sure if gene from lane 19 is a CqsA or not.
25/10/08
Plan for preparing BBs for shipment was established and first part of it carried out. BBs genes were purified for further digestion. However cleaned BBs weren't run on the analytical gel to save some time. They will be run tomorrow as digestion will change bands by size that agarose cannot resolve. The size estimated tomorrow will correspond to the size of the PCR products. DNA concentration in a sample was estimated to know how much of it to add to restriction digest mixture. Genes were restriction digested to generate sticky ends for further ligation with plasmid backbone.
Procedure for preparing BBs for shipment is as follows:
- clean a PCR products
- run the cleaned up products on the analytical gel
- check what is the concentration of DNA in a sample
- restriction digest BBs
- clean the digest
- run the analytical gel of the restriction digest
- purify the BB plasmid from the gel [this resolves plasmid backbone and CcdB gene and prevents from
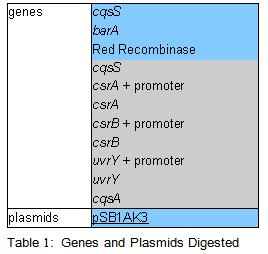
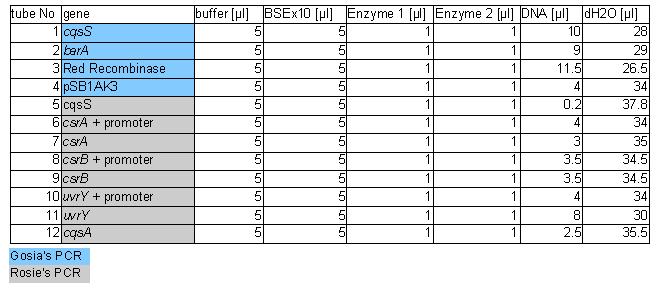
PCR was cleaned with QIAquick PCR purification kit from QIAGEN. Concentration of DNA in a sample was measured with spectrophotometer. Restriction digest was carried out as in the Protocol [X]. Genes were restriction digested with enzymes SpeI and EcoRI from NEB. Buffer used was NEB2 buffer from NEB. List of BBs genes and plasmids digested is given in a Table 1. Exact volumes of components of restriction digest mixture are listed in Table 2.
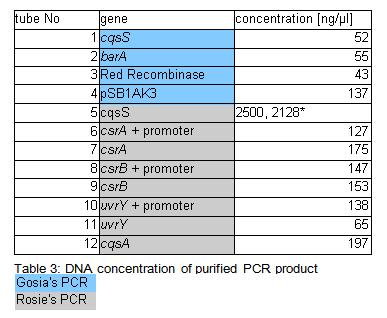
Samples containing gen barA and Red Recombinase were probably wrongly annotated – numbers corresponding to the tubes containing them were probably swapped during purification step. Which is which should be known tomorrow after the analytical gel is run. Concentration of those genes in the sample is very similar so digest should be fine in both cases.
Concentration of genes in the sample is given in a Table 3.
• because concentration of the cqsS gene were suspiciously high measurement was repeated few times. All readings oscillated around those two values. Samples were incubated overnight at 37*C (Rose: bright green tube rack).
 "
"
