IGEM:Cambridge/2008/Notebook/Voltage/Output
From 2008.igem.org
(Difference between revisions)
m |
|||
| (One intermediate revision not shown) | |||
| Line 14: | Line 14: | ||
</html> | </html> | ||
=Voltage Output= | =Voltage Output= | ||
| - | =Setup= | + | ==Setup== |
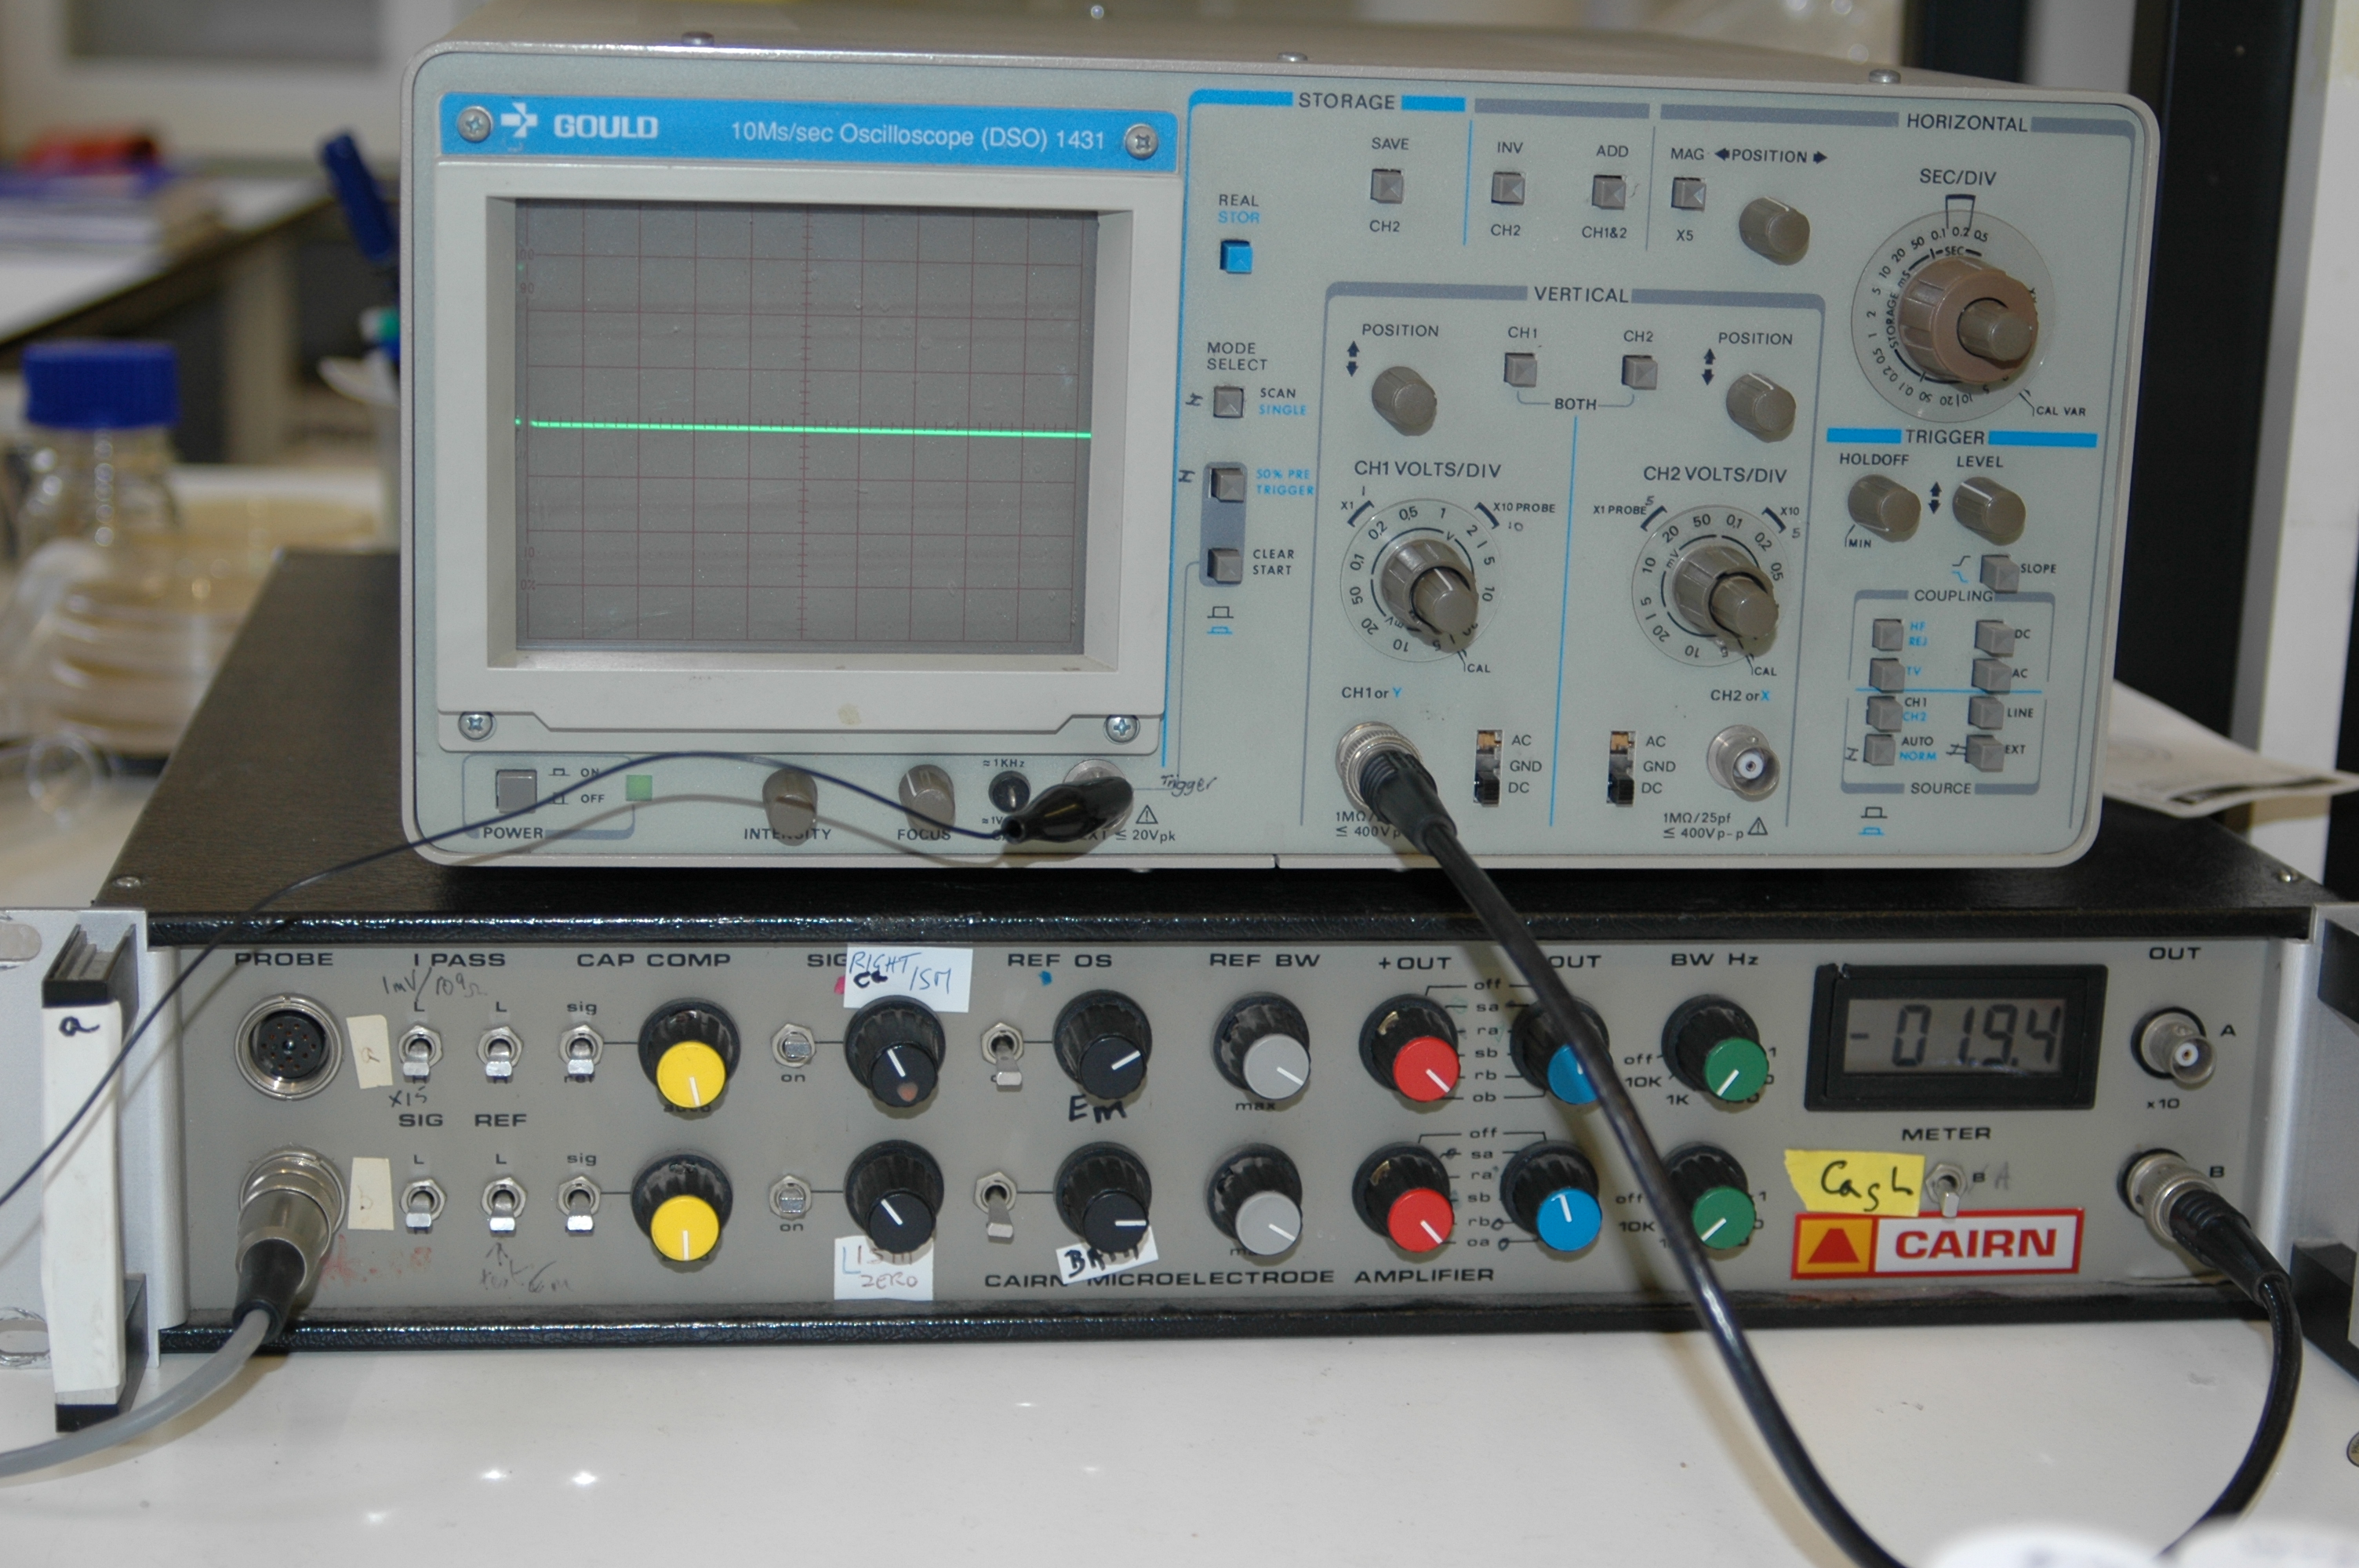
*Apparatus is setup as shown. An earth is needed next to the probe electrode, but not touching. They will be needed within the same solution to reduce the noise. | *Apparatus is setup as shown. An earth is needed next to the probe electrode, but not touching. They will be needed within the same solution to reduce the noise. | ||
*Oscilloscope is set to 0.2V/div and 0.2 sec/div | *Oscilloscope is set to 0.2V/div and 0.2 sec/div | ||
| Line 20: | Line 20: | ||
*Samples are then spun down in individual 1.5ml eppendorfs. | *Samples are then spun down in individual 1.5ml eppendorfs. | ||
| - | =Experiment= | + | ==Experiment== |
*Resuspend cells in 200μL clean NOK and place in sample wells | *Resuspend cells in 200μL clean NOK and place in sample wells | ||
*Lower probe electrode into cell solution and wait for stable reading - 1min. | *Lower probe electrode into cell solution and wait for stable reading - 1min. | ||
| Line 26: | Line 26: | ||
[[Image:Voltage_apparatus.jpg|500px| Apparatus setup]] | [[Image:Voltage_apparatus.jpg|500px| Apparatus setup]] | ||
| - | =Results= | + | ==Results== |
*With the setup above a voltage change could be observed on the oscilloscope. | *With the setup above a voltage change could be observed on the oscilloscope. | ||
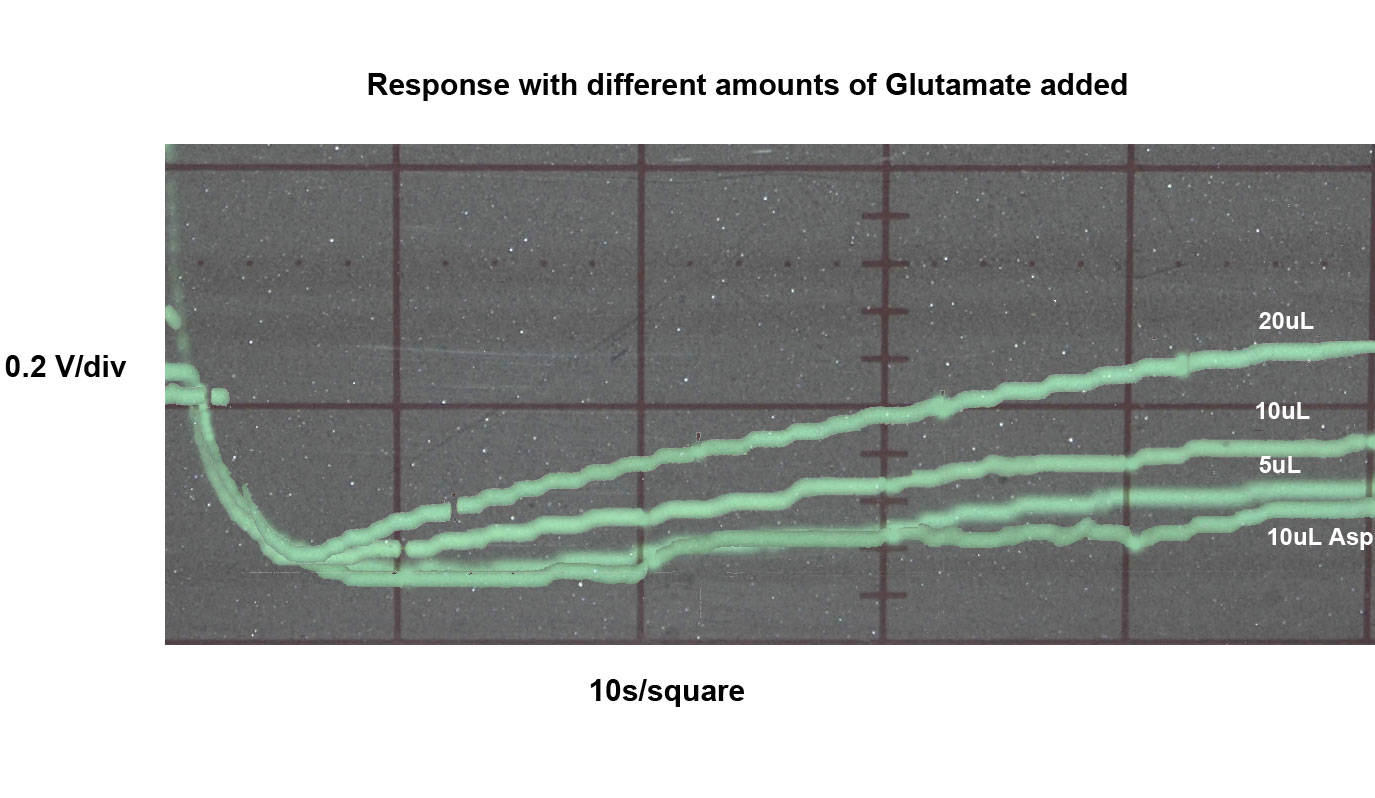
*The following results were recorded by adding different amounts of 10uL glutamate to the samples. | *The following results were recorded by adding different amounts of 10uL glutamate to the samples. | ||
| Line 35: | Line 35: | ||
[[Image:Voltage_Response.jpg |800px | Output at different GluR0 concentrations]] | [[Image:Voltage_Response.jpg |800px | Output at different GluR0 concentrations]] | ||
| - | These results show a dose | + | These results show a dose dependent voltage change. The initial drop in voltage is probably due to the addition of a dilute solution of an organic ion. However it is not particularly dose dependent with respect to actual volume. It may well be related to how quickly the ions spread away from the probe. The overall response of adding glutamate is a rise in voltage, and is related to amount of glutamate. The 20uL addition rose to above the starting value after about 1 minute, and continued to rise. |
-N.b. The value of the oscilloscope reading is not actual output of the cells as the output has been through the amplifier and the probe also has an amplifier in it. | -N.b. The value of the oscilloscope reading is not actual output of the cells as the output has been through the amplifier and the probe also has an amplifier in it. | ||
Latest revision as of 22:33, 29 October 2008
|
x
Voltage OutputSetup
Experiment
Results
 *10uL Aspartate produced the bottom curve, showing very little recover
 *5uL Glutamate gave the next curve
 *10uL Glutamate gave the third curve
 *20uL Glutamate gave the best recovery, reaching the highest level
These results show a dose dependent voltage change. The initial drop in voltage is probably due to the addition of a dilute solution of an organic ion. However it is not particularly dose dependent with respect to actual volume. It may well be related to how quickly the ions spread away from the probe. The overall response of adding glutamate is a rise in voltage, and is related to amount of glutamate. The 20uL addition rose to above the starting value after about 1 minute, and continued to rise. -N.b. The value of the oscilloscope reading is not actual output of the cells as the output has been through the amplifier and the probe also has an amplifier in it.
x
|
 "
"

