User:Federico Castro M/Horizontal Transfer/Models Simulations
From 2008.igem.org
m (Return link added) |
|||
| Line 7: | Line 7: | ||
dynamics models. We assume that each bacterium type grows according to | dynamics models. We assume that each bacterium type grows according to | ||
a logistic equation: | a logistic equation: | ||
| + | |||
<center> | <center> | ||
| - | [[Image: | + | |
| + | [[Image:Ecuaciones_HGT(2).jpg]] | ||
| + | |||
</center> | </center> | ||
| + | |||
where a is the growth rate and K is the carrying capacity. | where a is the growth rate and K is the carrying capacity. | ||
| Line 22: | Line 26: | ||
the nonresistent types) and a third increasing curve corresponding to the strain resistent to both. | the nonresistent types) and a third increasing curve corresponding to the strain resistent to both. | ||
{| | {| | ||
| - | |||
|[[Image:Fig4UNAMIPN.JPG |400px]] | |[[Image:Fig4UNAMIPN.JPG |400px]] | ||
| + | |[[Image:Fig3UNAMIPN.JPG |460px]] | ||
| + | |||
|} | |} | ||
<font> | <font> | ||
Revision as of 01:58, 30 October 2008
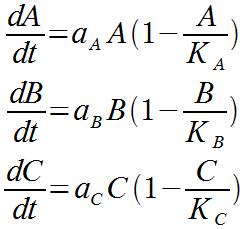
The mathematical study and simulations are based on population dynamics models. We assume that each bacterium type grows according to a logistic equation:
where a is the growth rate and K is the carrying capacity.
Therefore, type A and B have a specific grow rate and carrying capacity, since
they are in a medium where only one antibiotic is present, to which each one is resistent.
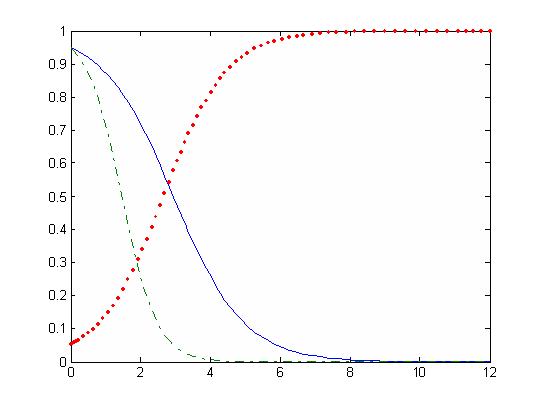
Later on, both populations are exposed to the two antibiotics in lethal concentrations and so only those bacteria that have acquired resistence to the other antibiotic will be able to survive. This is represented in turn by a change of sign in the growth rate. For those in which horizontal transport has not taken place yet it becomes negative, while for the third kind, already resistant to both ampicillin and tetracycline a new logistic equation with positive growth rate is used.
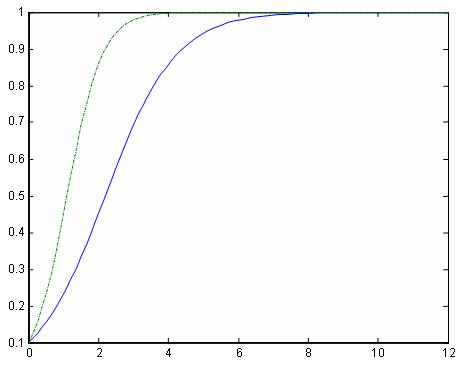
This is seen in the following figures. In the first one both curves increase, while in the second two decrease (corresponding to the nonresistent types) and a third increasing curve corresponding to the strain resistent to both.

| 
|
 "
"
