Team:NTU-Singapore/Modelling/Parameter/A B
From 2008.igem.org
(Difference between revisions)
Lalala8585 (Talk | contribs) (New page: <html><link rel="stylesheet" href="http://greenbear88.googlepages.com/ntu_igem.css" type="text/css"></html> <div id="header">{{User:Greenbear/sandbox/header}}</div> <div id="maincontent"...) |
Lalala8585 (Talk | contribs) |
||
| Line 3: | Line 3: | ||
<div id="header">{{User:Greenbear/sandbox/header}}</div> | <div id="header">{{User:Greenbear/sandbox/header}}</div> | ||
| - | |||
| - | + | <div id="maincontent" style="margin-top:100px;"> | |
| + | <html> | ||
| + | <div id="arrow"> | ||
| + | <a href="https://2008.igem.org/Team:NTU-Singapore/Modelling/Parameter"> | ||
| + | <img src="https://static.igem.org/mediawiki/2008/2/28/Back_to_param2.png" | ||
| + | alt="Back to parameter estimation" | ||
| + | title="Back to parameter estiamtion"> | ||
| + | </a> | ||
| + | </div> | ||
| + | </html> | ||
| + | |||
=Parameter A & B analysis= | =Parameter A & B analysis= | ||
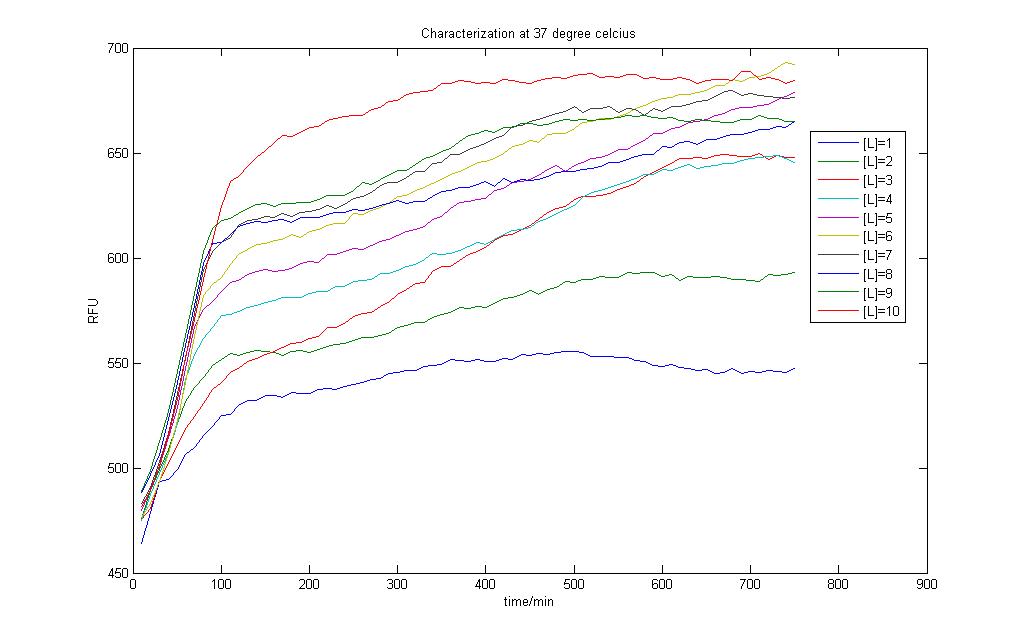
| - | + | [[Image:Charac_Result37.jpg|center|thumb|850px|Graph of RFU Results]] | |
The above is the results from our characterisation experiment<br> | The above is the results from our characterisation experiment<br> | ||
| Line 16: | Line 25: | ||
'''Graph of A & B''' <br> | '''Graph of A & B''' <br> | ||
| - | [[Image:VaryingB_Aconst.jpg|850px| A&B]] | + | [[Image:VaryingB_Aconst.jpg|thumb|center|850px|Graph of A&B]] |
We see here that as B gets closer to A the output it reduced. We choose B = 0.9 and A = 1, a 9:10 ratio. | We see here that as B gets closer to A the output it reduced. We choose B = 0.9 and A = 1, a 9:10 ratio. | ||
Revision as of 02:08, 25 October 2008
|
Parameter A & B analysis
The above is the results from our characterisation experiment
Here we attempt to change A & B over a range of values to observe how the two values affect the production of the complex. We are bound by a simple condition that A > B. We set A = 1 and vary B over a range.
Graph of A & B
 "
"


