Team:Imperial College/Genetic Circuit
From 2008.igem.org
| Line 9: | Line 9: | ||
[[Image:Eq1.png]] | [[Image:Eq1.png]] | ||
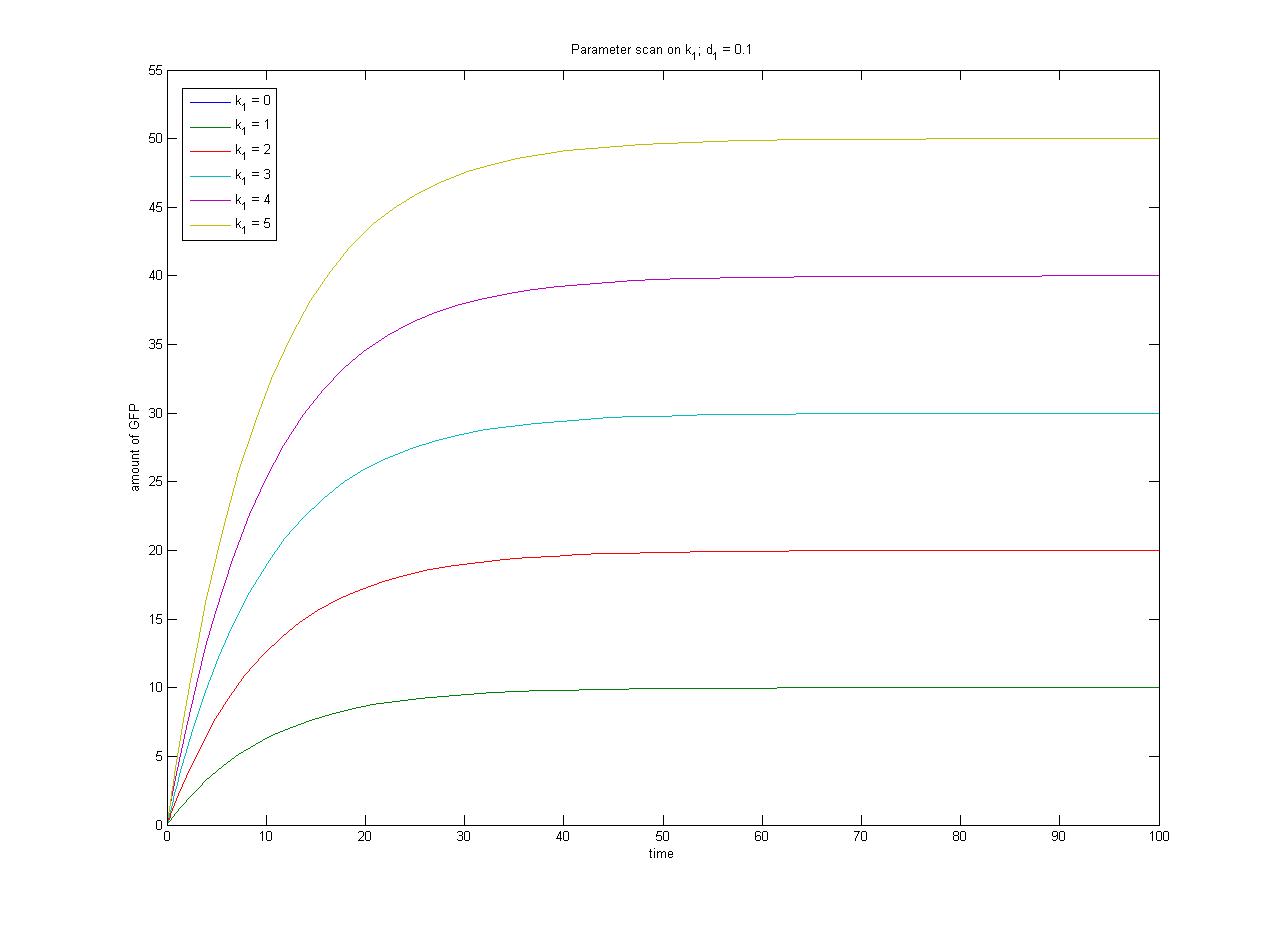
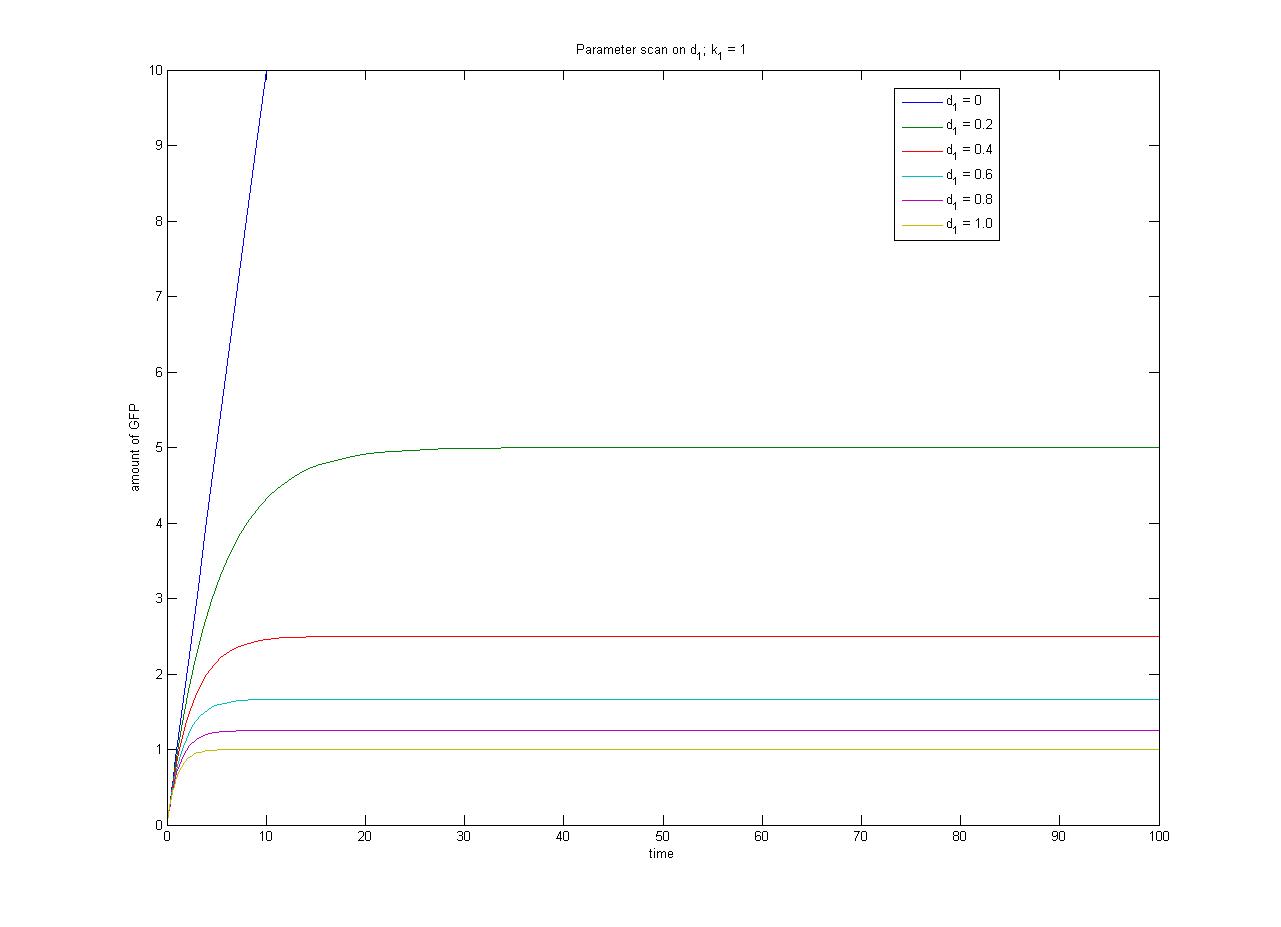
| - | In this case, | + | In this case, [protein] represents the concentration of GFP, k1 represents the rate of sythesis and d1 represents the degradation rate. |
We can easily simulate this synthesis-degradation model using matlab:<br> | We can easily simulate this synthesis-degradation model using matlab:<br> | ||
[[Media:Gfp.m|ODE]]<br> | [[Media:Gfp.m|ODE]]<br> | ||
| Line 17: | Line 17: | ||
We can also solve this ODE analytically. Consider the steady-state behaviour of <math>[protein]</math>. | We can also solve this ODE analytically. Consider the steady-state behaviour of <math>[protein]</math>. | ||
| - | + | [[Image:Eq2.png]] | |
This relationship can be seen in the parameter scan graphs on the right. | This relationship can be seen in the parameter scan graphs on the right. | ||
Revision as of 14:50, 21 October 2008
Modelling the Genetic Circuit
|
|||||||||||||||||
 "
"


