Team:EPF-Lausanne/Modeling
From 2008.igem.org
(→Simulation) |
(→Double input model) |
||
| Line 3: | Line 3: | ||
=='''Double input model'''== | =='''Double input model'''== | ||
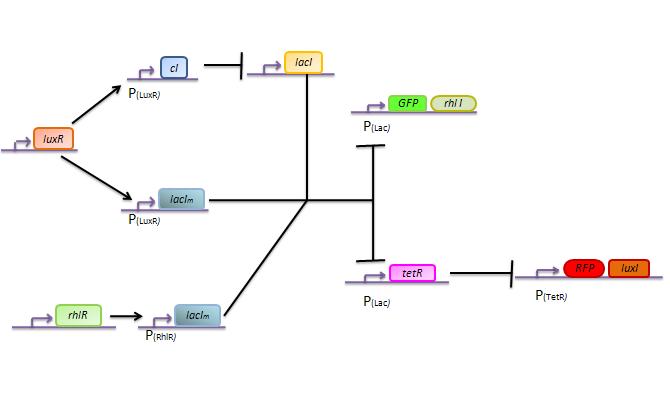
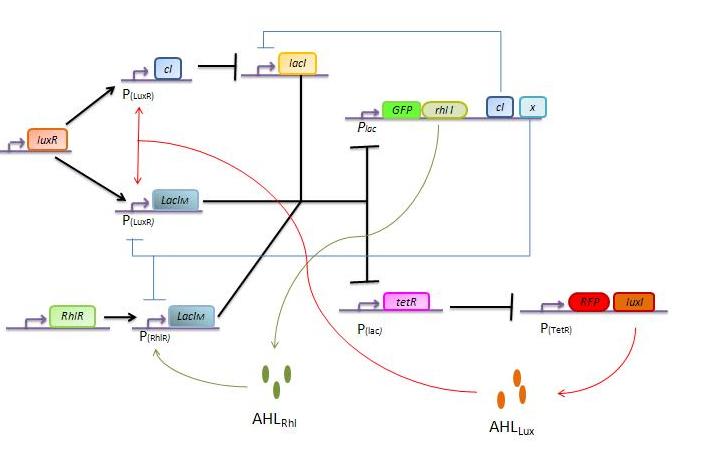
| - | Here we describe a semi-quantitative model of the Lux band-pass detector and the Rhl high-pass detector. The model describes each proteins and sending molecules involved in the system. | + | Here we describe a semi-quantitative model of the Lux band-pass detector and the Rhl high-pass detector. The model describes each proteins and sending molecules involved in the system. At this stage, we test the ability of the system to process a constant input of green or red (ALux or ARhl) and choose an output state, either red or green. |
[[Image:Genscheme.jpg|500px|center]] | [[Image:Genscheme.jpg|500px|center]] | ||
Revision as of 17:04, 29 October 2008
| Home | The Team | The Project | Parts | 2-step PCR | Microfluidics | Modeling | Notebook |
|---|
Contents |
Double input model
Here we describe a semi-quantitative model of the Lux band-pass detector and the Rhl high-pass detector. The model describes each proteins and sending molecules involved in the system. At this stage, we test the ability of the system to process a constant input of green or red (ALux or ARhl) and choose an output state, either red or green.
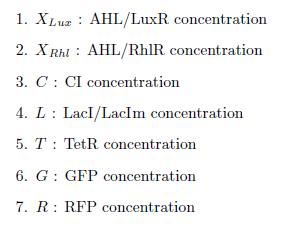
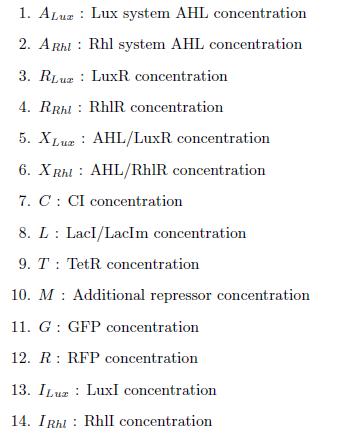
States
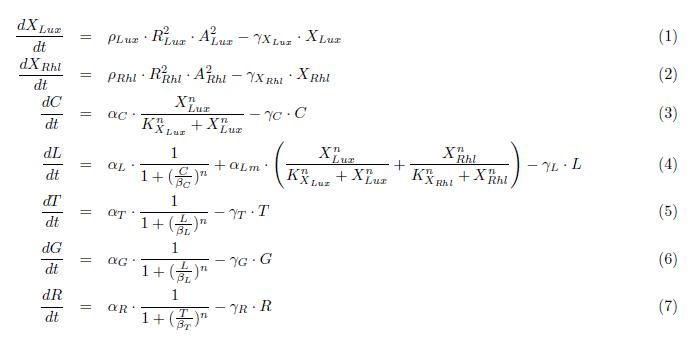
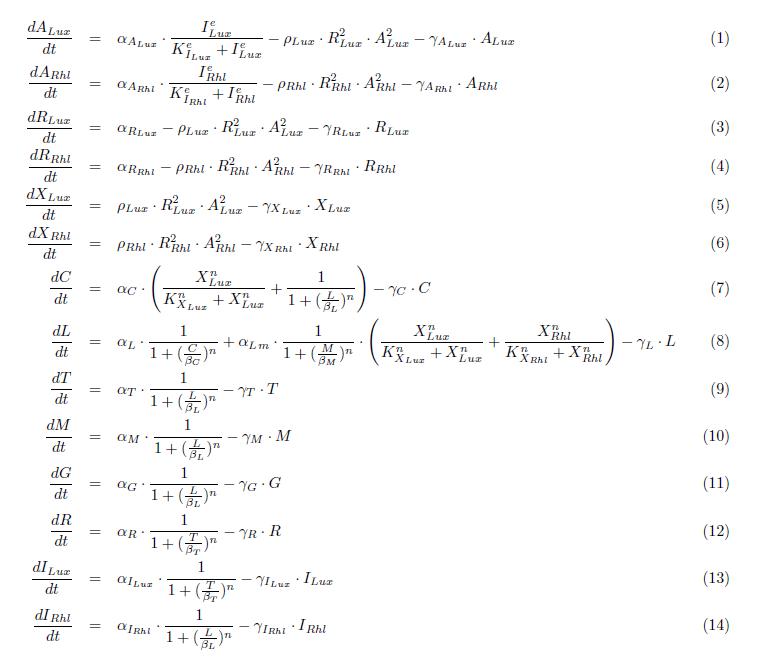
ODEs
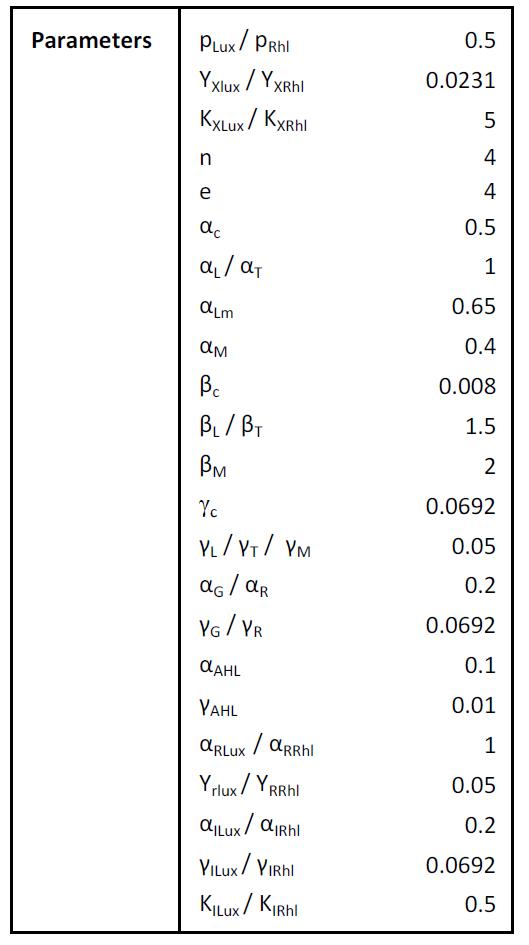
Parameters
Simulation
Bistable switch model
States
ODEs
Parameters
Simulation
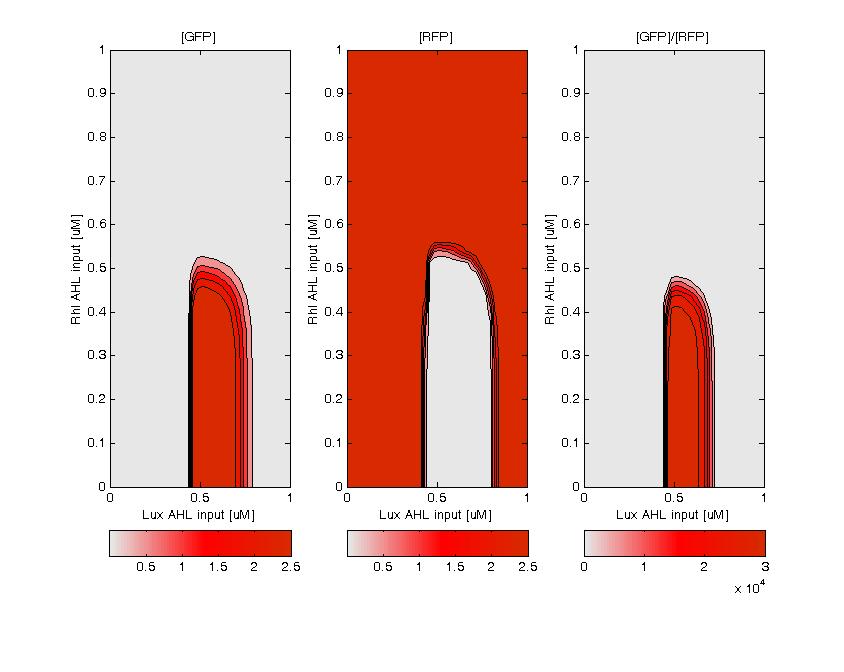
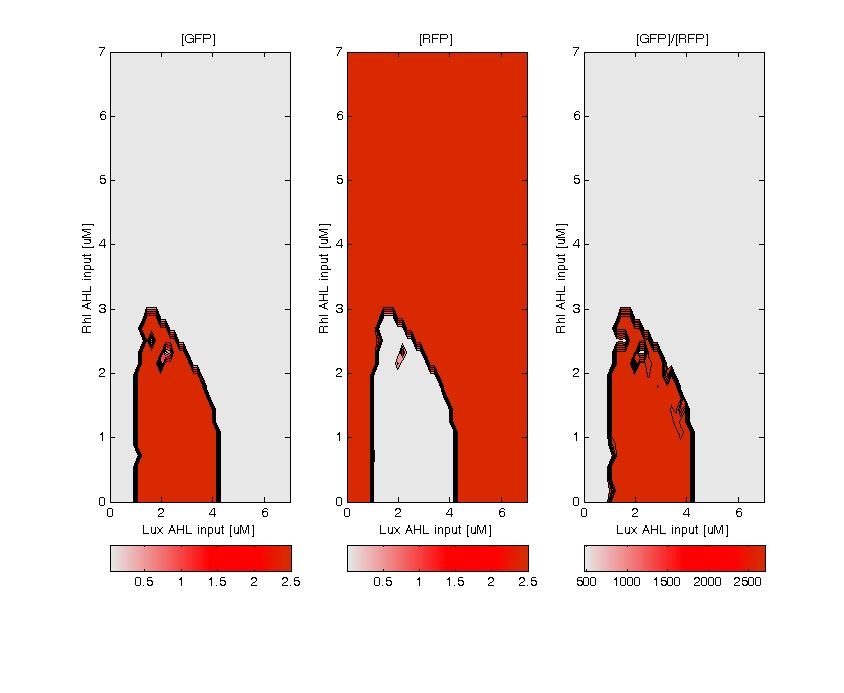
GFP (left) and RFP (middle) expression for concentration of AHL (Lux or Rhl) pulses. On the right, figure shows the ratio of GFP/RFP. This results shows that a given range of AHL can produce the green state. This is in good agreement with the rule set that we propose, where only medium level of red input (AHL Lux) and low to medium level of green input (AHL Rhl) can generate green.
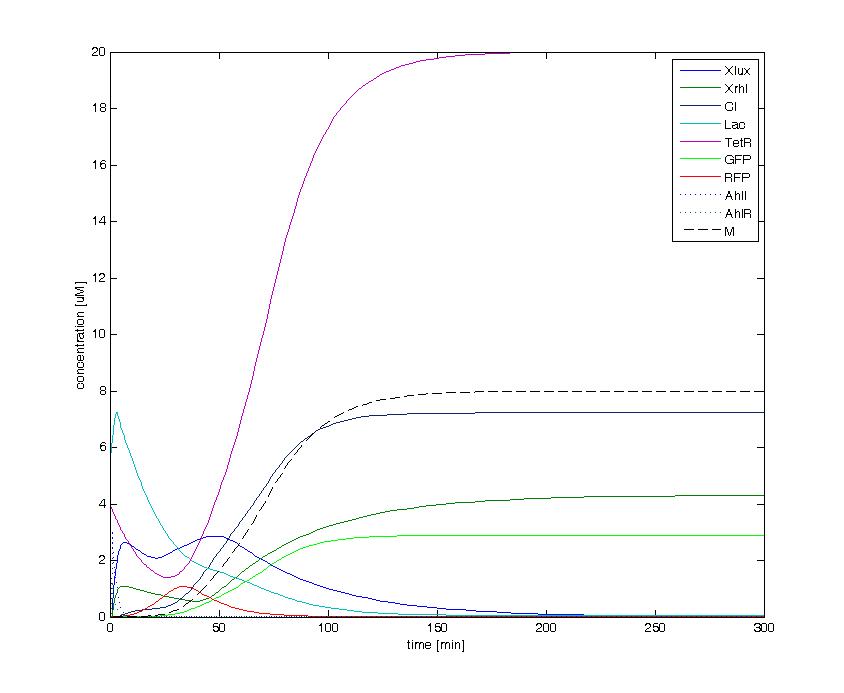
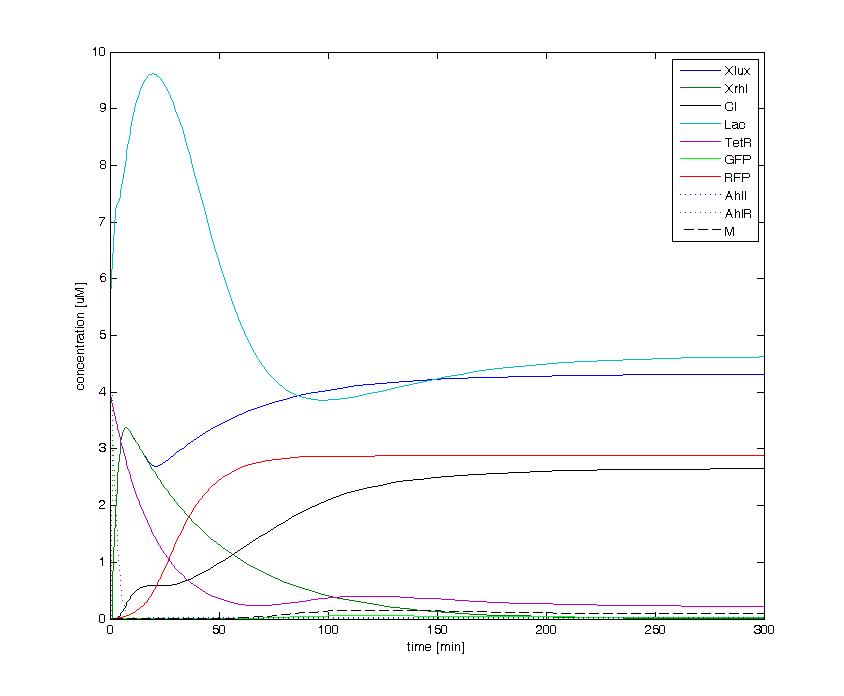
The following figures show the dynamics of the different states involved in the system for different AHL pulses. On the left, the system is locked into the green state after a pulse of 1.6 uM of Lux AHL and 3 uM of Rhl AHL. On the right, the system is locked into the red state after a pulse of 4 uM of Lux AHL and 4 uM of Rhl AHL. The model nicely shows the dominance of either TetR (purple line) or LacI (light blue line) for the green, respectively red state. It also shows the importance of the twos negative feedback made by the M represssor (dashed line) and CI (black line) to maintain the system in the green state.
 "
"
