Team:Imperial College/Growth Curve
From 2008.igem.org
m |
|||
| Line 40: | Line 40: | ||
====== Stationary Phase ====== | ====== Stationary Phase ====== | ||
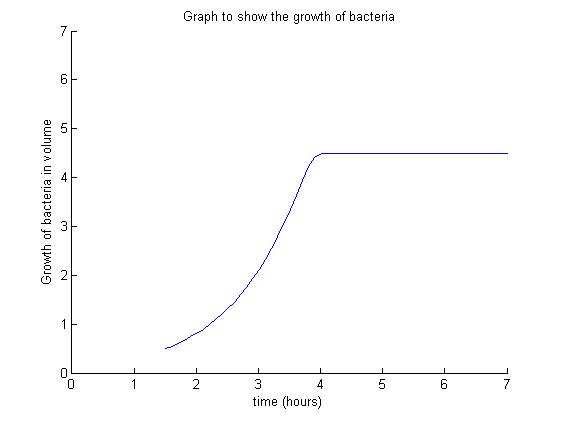
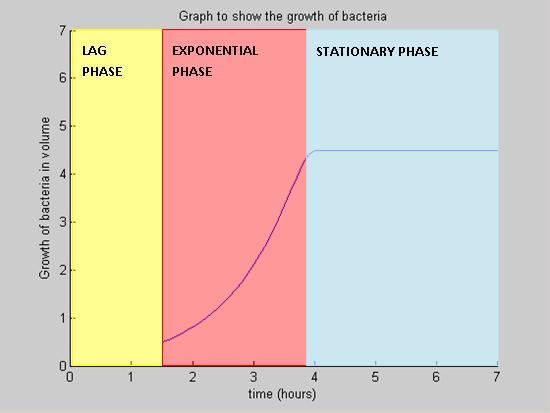
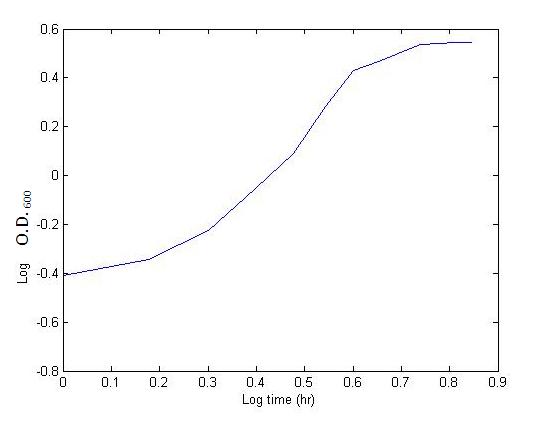
The growth of the colony ceases in number and in volume. This happens when the colony has consumed all available nutrients. Other contributing factors may be death and cell division. | The growth of the colony ceases in number and in volume. This happens when the colony has consumed all available nutrients. Other contributing factors may be death and cell division. | ||
| - | |||
| - | |||
| - | |||
<br> | <br> | ||
<br> | <br> | ||
| Line 50: | Line 47: | ||
<br> | <br> | ||
<br> | <br> | ||
| + | |||
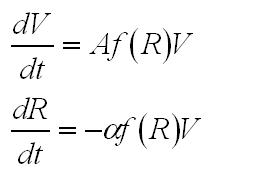
We chose to represent the growth in terms of overall volume rather than number of cells. | We chose to represent the growth in terms of overall volume rather than number of cells. | ||
| Line 61: | Line 59: | ||
[[Image:Growth_equ.JPG|150px]] | [[Image:Growth_equ.JPG|150px]] | ||
| - | <br><br> | + | <br><br><br> |
| - | + | ||
| + | |||
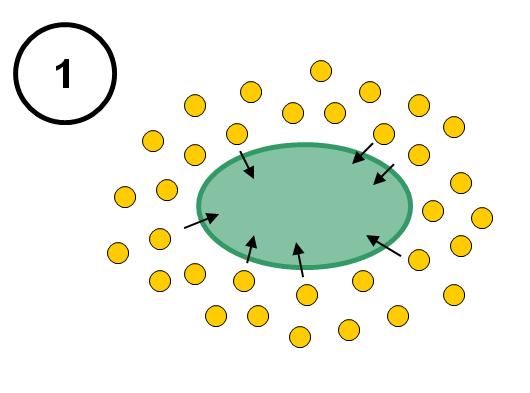
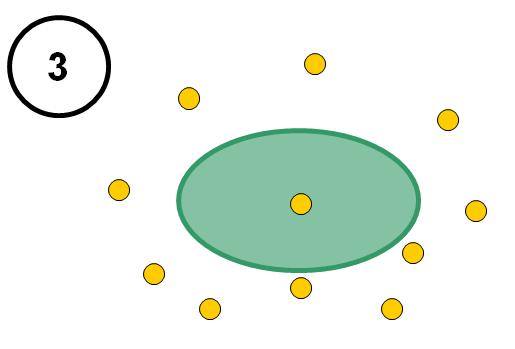
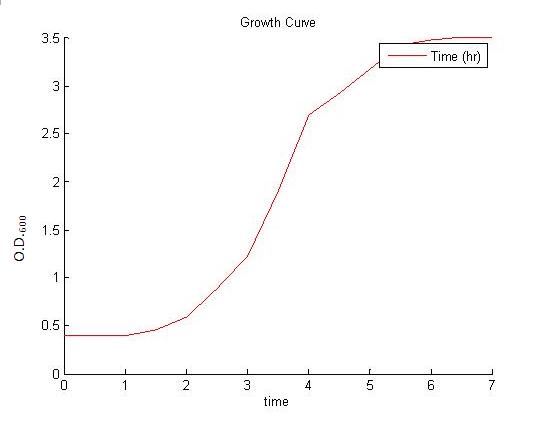
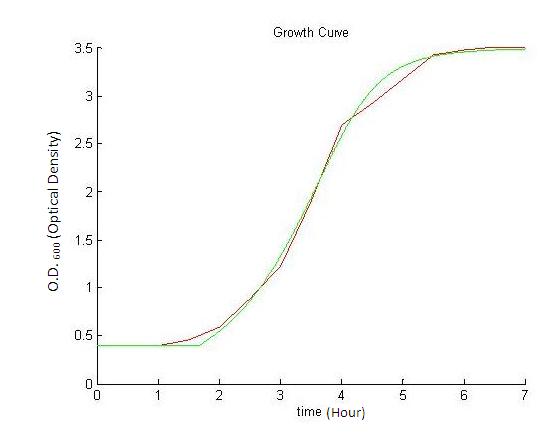
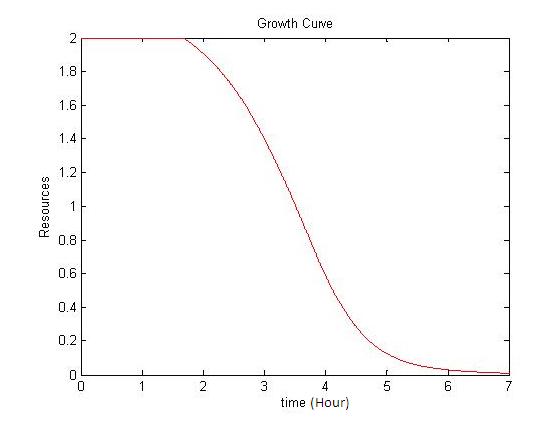
Below is a typical model used for modelling the growth of bacteria. A high growth rate, as illustrated by the model below, will cause nutrients to be uptaken quickly resulting in a 'nutrient crash'. As the amount of resources are limited, the growth curve eventually become flat in the stationary phase. This is when the growth of the bacteria ceases. | Below is a typical model used for modelling the growth of bacteria. A high growth rate, as illustrated by the model below, will cause nutrients to be uptaken quickly resulting in a 'nutrient crash'. As the amount of resources are limited, the growth curve eventually become flat in the stationary phase. This is when the growth of the bacteria ceases. | ||
<center>[[Image:nutrient_ft.JPG|350px]][[Image:Label_model.JPG|350px]]</center>}} | <center>[[Image:nutrient_ft.JPG|350px]][[Image:Label_model.JPG|350px]]</center>}} | ||
| + | |||
| + | |||
{{Imperial/Box1|Results| | {{Imperial/Box1|Results| | ||
Revision as of 20:55, 29 October 2008
Modelling the Growth Curve
|
|||||||||||||||||
 "
"

