Team:Imperial College/Genetic Circuit Details

From 2008.igem.org

(Difference between revisions)
m
Line 32: Line 32:
}}
}}
-
{{Imperial/Box1|More Sophisticated Model({{ref|2}})|
+
{{Imperial/Box1|More Sophisticated Model ({{ref|2}})|
[[Image:Inducible_promoters_2.jpg|450px]]
[[Image:Inducible_promoters_2.jpg|450px]]
-
====Equilibria====
+
====== Equilibria ======
[[Image:Complex_model_equilibria.jpg‎|350px]]
[[Image:Complex_model_equilibria.jpg‎|350px]]
Line 46: Line 46:
Note: k<sub>2</sub>, k<sub>3</sub>, k<sub>4</sub>, k<sub>5</sub>, k<sub>6</sub> and k<sub>7</sub> represent binding constants for formation and dissociation of complexes.
-
====Equations====
+
====== Equations ======
Before IPTG is introduced the system is in a steady state:
Line 64: Line 64:
These are evaluated numerically using Matlab's ODE solver.
-
====Qualitative effect of parameters on behaviour====
+
====== Qualitative effect of parameters on behaviour ======
Two different regimes of behaviour can be exhibited by the concentration of GFP over time as described by the more complex model, dependent on the parameters defining the ODE system.

Revision as of 02:49, 30 October 2008


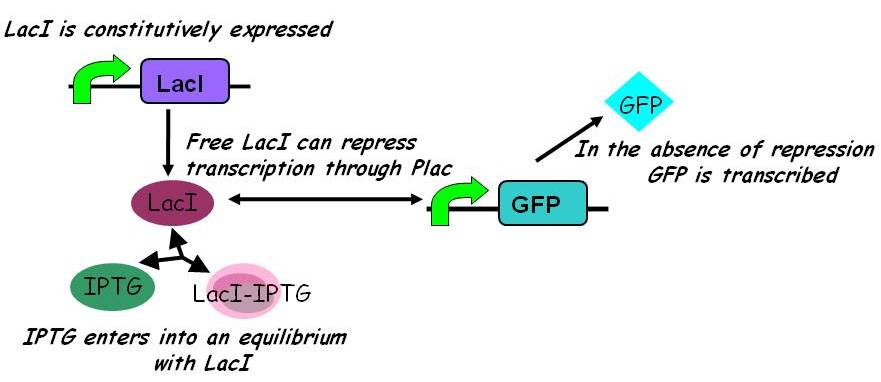
Simple Model (1)


Igem2008 - inducible promoters.jpg

Equilibria

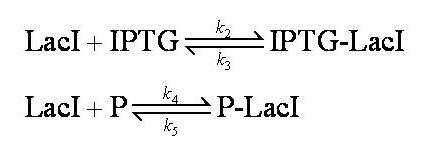
Interactions between IPTG, LacI and free promoter and the formation of the promoter-LacI and IPTG-LacI complexes are described using the following equilibria.

Simple model equilibria.jpg

Note: 1:1 stoichiometry has been assumed; this model could be adapted to use different stoichiometric coefficients.

k2, k3, k4 and k5 represent binding constants for formation and dissociation of complexes.

Equations

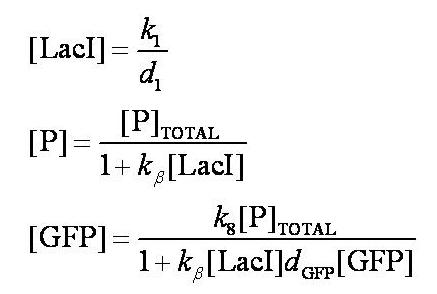
Before IPTG is introduced the system is at steady-state. The steady-state levels of LacI, free promoter, and GFP are given by:

Simple model steady state pre induction.jpg

Note: k1 and k8 represent the rate of transcription through the constitutive promoter upstream of LacI and the promoter upstream of GFP respectively.

d1 and dGFP represent the degradation rates of LacI and GFP respectively.

kß is defined as k4/k5.

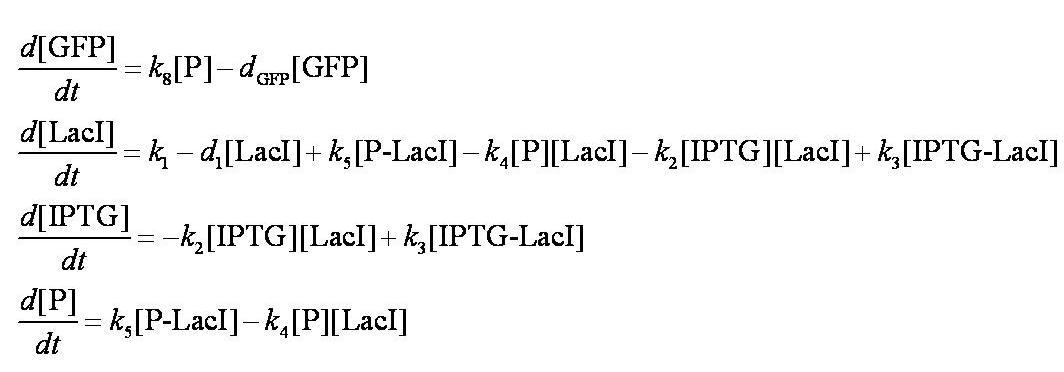
To describe the change in concentration of the interacting species over time we used the following system of differential equations:

Simple model ODEs.jpg

These are evaluated numerically using Matlab's ODE solver.

Note from the differential equations above that the steady-state concentration of free promoter will be independent of the concentration of IPTG introduced into the system. The pre-steady-state maximum concentrotion of GFP attained will differ, however - this is illustrated on the Genetic Circuit page and can be explored further using the simulations.


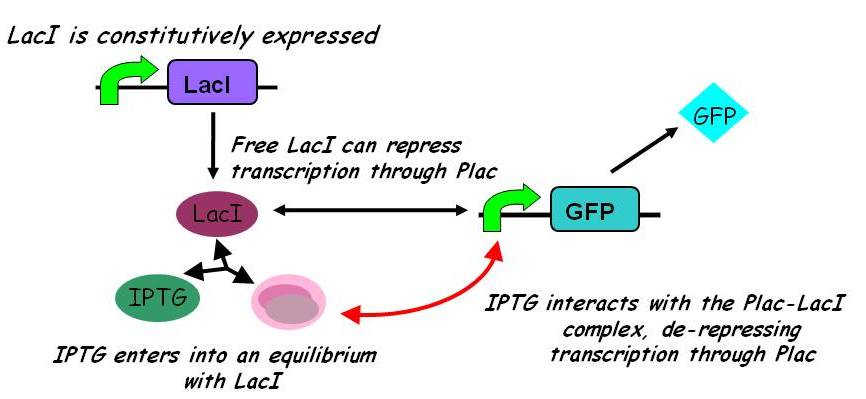
More Sophisticated Model (2)


Inducible promoters 2.jpg

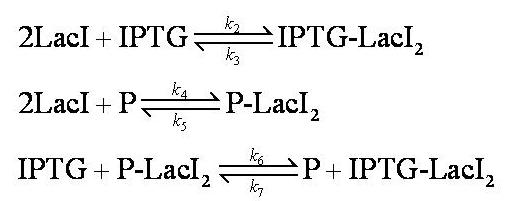
Equilibria

Complex model equilibria.jpg

Assumptions:

No intermediary P-IPTG-LacI complex is formed.

We assumed 2 LacI molecules bind to the promoter, in accordance with the model description (2).

Note: k2, k3, k4, k5, k6 and k7 represent binding constants for formation and dissociation of complexes.

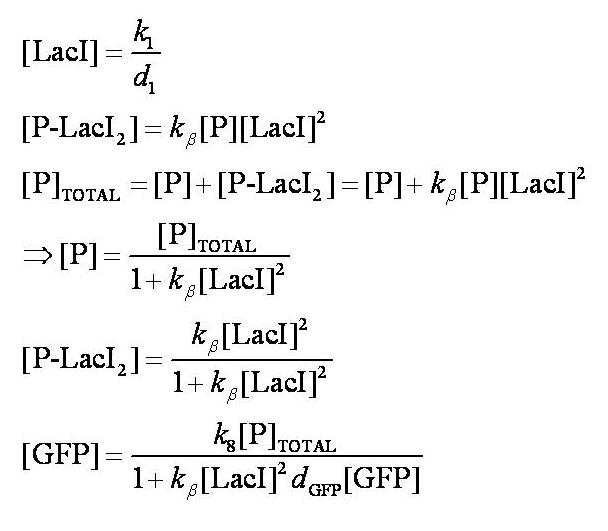
Equations

Before IPTG is introduced the system is in a steady state:

Pre IPTG Steady States Complex Model.jpg

Note: k1 and k8 represent the rate of transcription through the constitutive promoter upstream of LacI and the promoter upstream of GFP respectively.

d1 and dGFP represent the degradation rates of LacI and GFP respectively.

kß is defined as k4/k5.

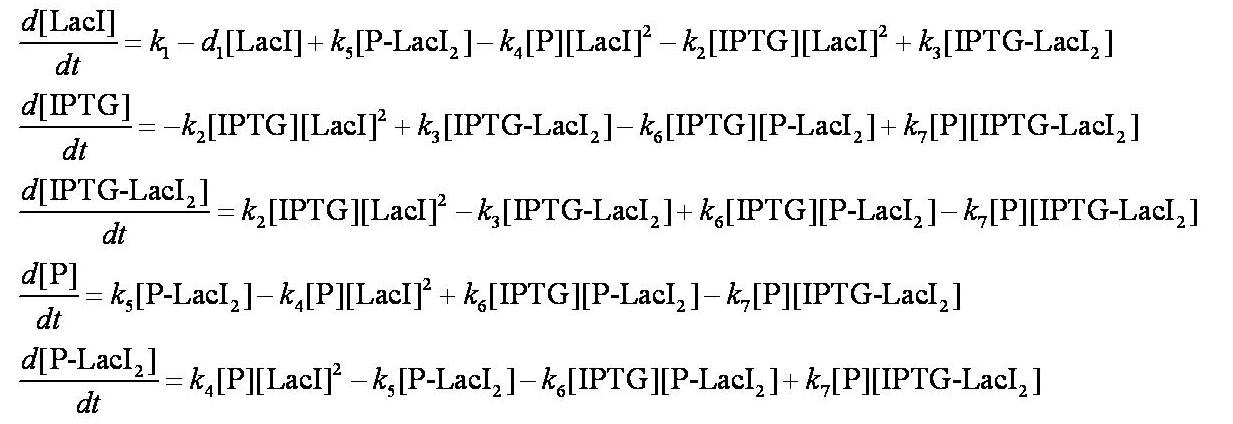
When IPTG is introduced, the dynamic behaviour of the system is described using a system of ODEs.

Complex Model ODEs.jpg

These are evaluated numerically using Matlab's ODE solver.

Qualitative effect of parameters on behaviour

Two different regimes of behaviour can be exhibited by the concentration of GFP over time as described by the more complex model, dependent on the parameters defining the ODE system.

Either the concentration of GFP increases up to a steady-state value, or it displays a hump, increasing to a maximum before returning to a lower steady-state level. This latter case is illustrated on the Genetic Circuit page but both cases can be explored using the simulations. The two regimes of behaviour are parameter-dependent and depend on the relative strengths of repression by LacI biding to the promoter and de-repression due to the interaction of IPTG with the Promoter-LacI complex.

It can be shown that the larger the ratio of relative strengths of de-repression and repression, the larger the gain in fluorescence before the steady state is reached.


References
  1. Alon, U (2006) An Introduction to Systems Biology: Design Principles of Biological Circuits - Chapman & Hall/Crc Mathematical and Computational Biology
  2. Kuhlman T, Zhang Z, Saier MH Jr, & Hwa T (2007) Combinatorial transcriptional control of the lactose operon of Escherichia coli. - PNAS 104 (14) 6043-6048