Team:Imperial College/Biobricks
From 2008.igem.org
m |
|||
| Line 5: | Line 5: | ||
[[Image:Biobricks Imperial.PNG|center|500px]] | [[Image:Biobricks Imperial.PNG|center|500px]] | ||
}} | }} | ||
| - | |||
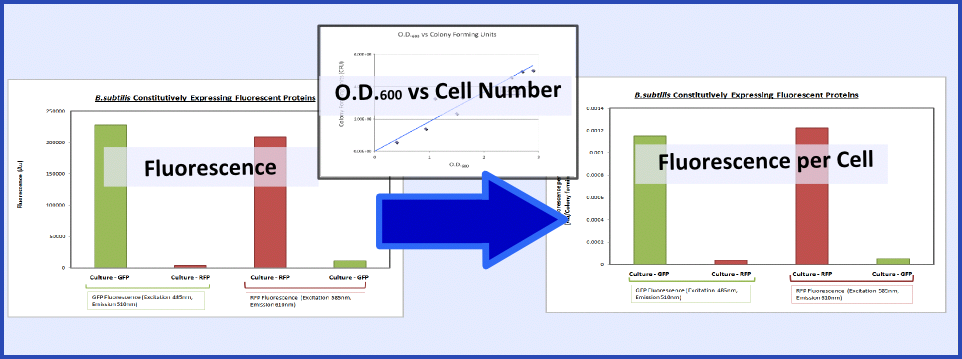
{{Imperial/Box1|Summary of Data|The promoter and RBS combinations were characterised by measuring the expression of fluorescent proteins in ''B.subtilis''. Cultures of ''B.subtilis'' transformed with the test constructs and non-transformed ''B.subtilis'' (control) were grown to the mid-log phase. Fluorescence and O.D.<sub>600</sub> were both measured using a plate reader to generate fluorescence levels of the various samples. To make this data more generic, the fluorescence data were normalized to cell number using the O.D.<sub>600</sub> and a '''calibration curve of O.D.<sub>600</sub> vs colony forming units''', as explained in the diagram below: | {{Imperial/Box1|Summary of Data|The promoter and RBS combinations were characterised by measuring the expression of fluorescent proteins in ''B.subtilis''. Cultures of ''B.subtilis'' transformed with the test constructs and non-transformed ''B.subtilis'' (control) were grown to the mid-log phase. Fluorescence and O.D.<sub>600</sub> were both measured using a plate reader to generate fluorescence levels of the various samples. To make this data more generic, the fluorescence data were normalized to cell number using the O.D.<sub>600</sub> and a '''calibration curve of O.D.<sub>600</sub> vs colony forming units''', as explained in the diagram below: | ||
Revision as of 01:49, 30 October 2008
|
||||||||
 "
"


