Team:NTU-Singapore/Modelling/Parameter/LysisaD
From 2008.igem.org
(Difference between revisions)
Lalala8585 (Talk | contribs) |
Lalala8585 (Talk | contribs) |
||
| Line 7: | Line 7: | ||
[https://2008.igem.org/Team:NTU-Singapore/Modelling/Parameter Back to Parameter Estimation] | [https://2008.igem.org/Team:NTU-Singapore/Modelling/Parameter Back to Parameter Estimation] | ||
| + | =Parameter aD analysis= | ||
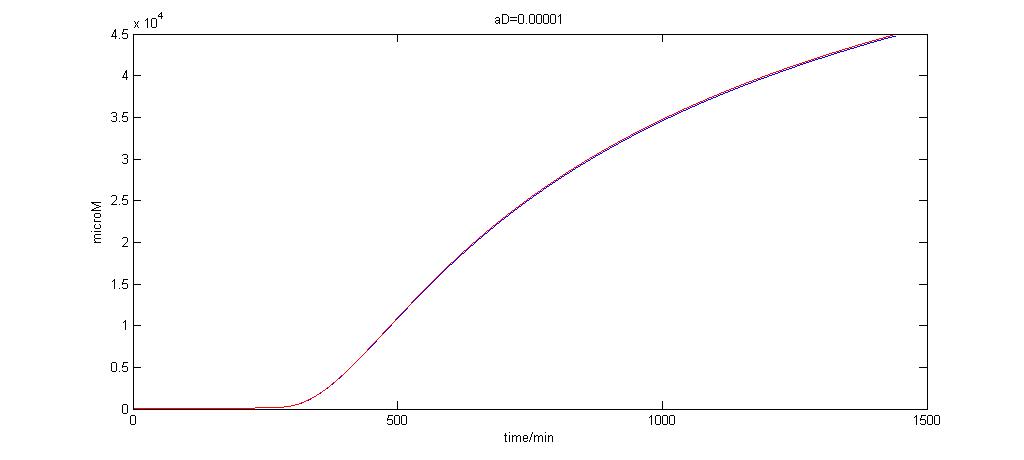
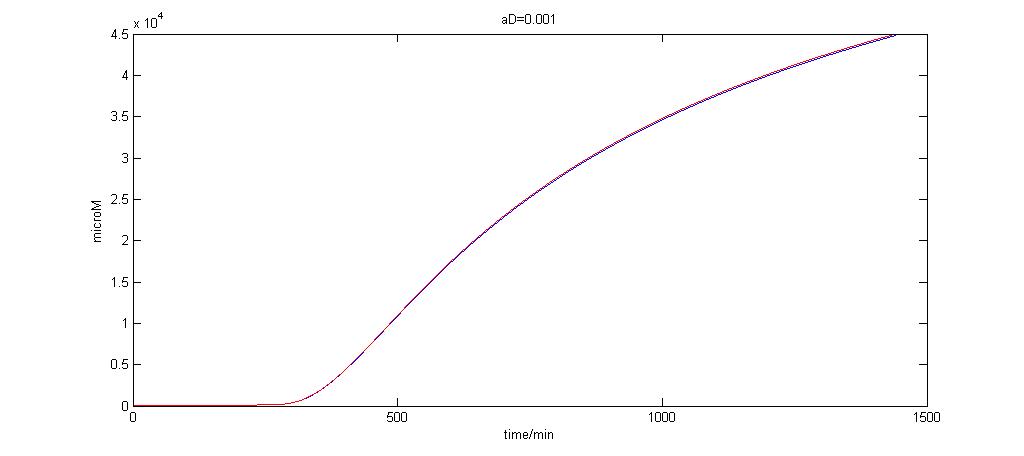
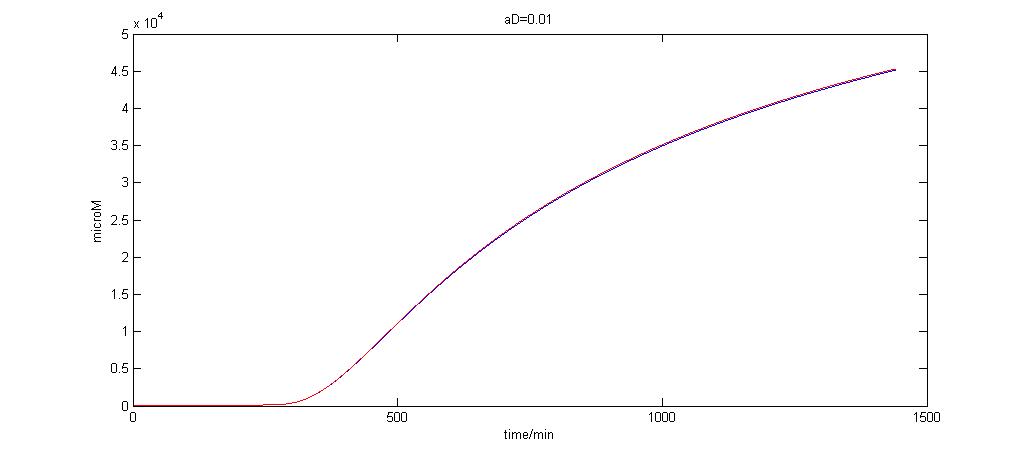
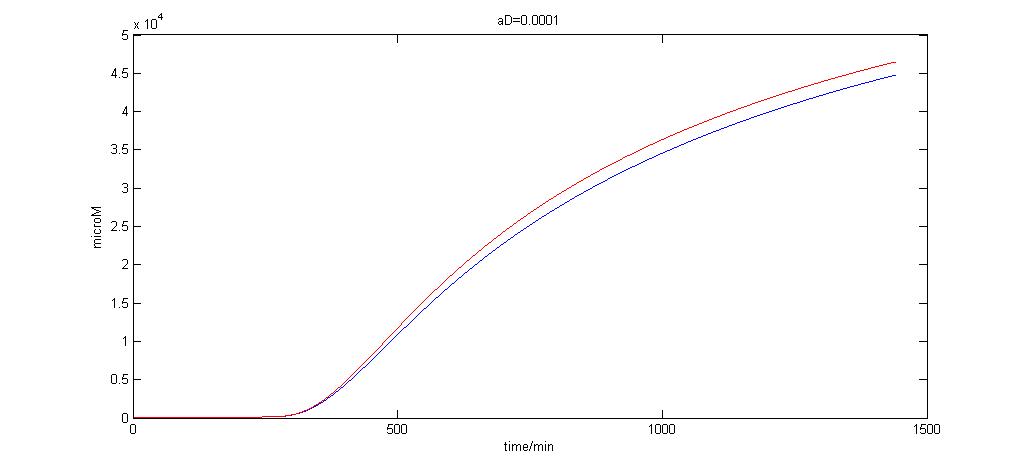
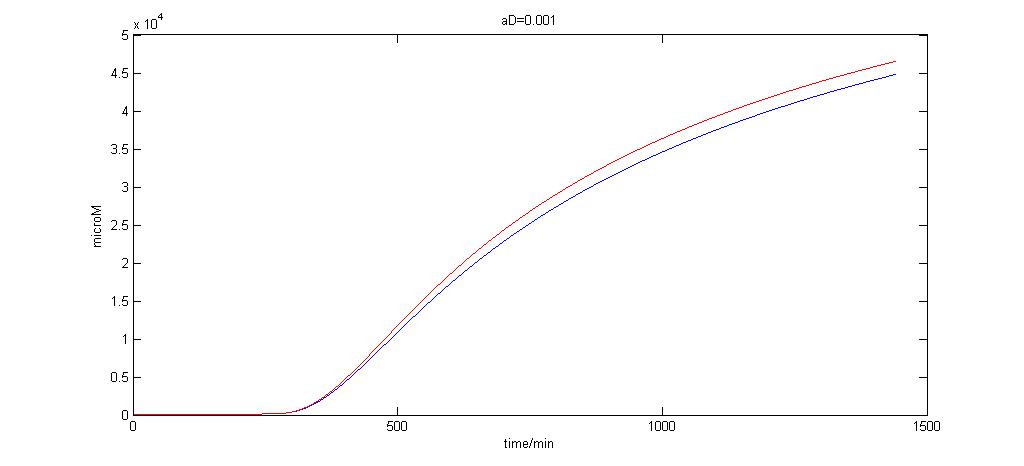
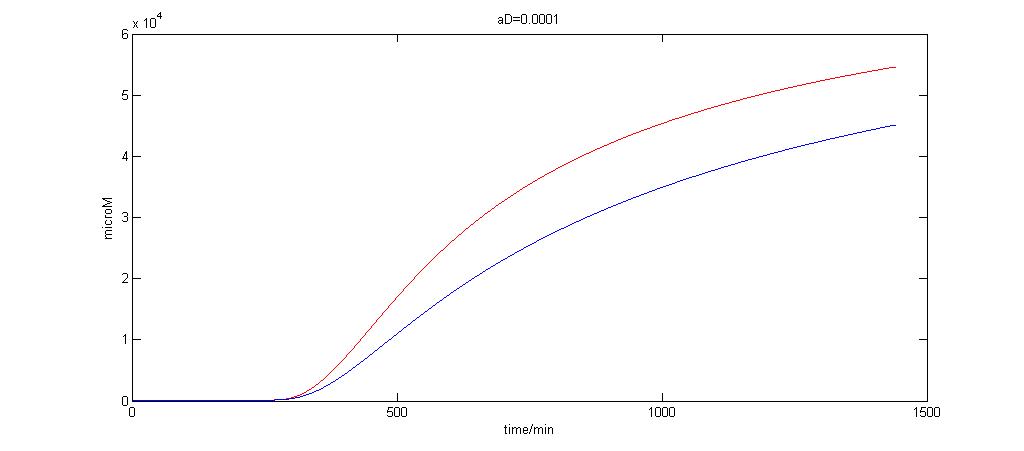
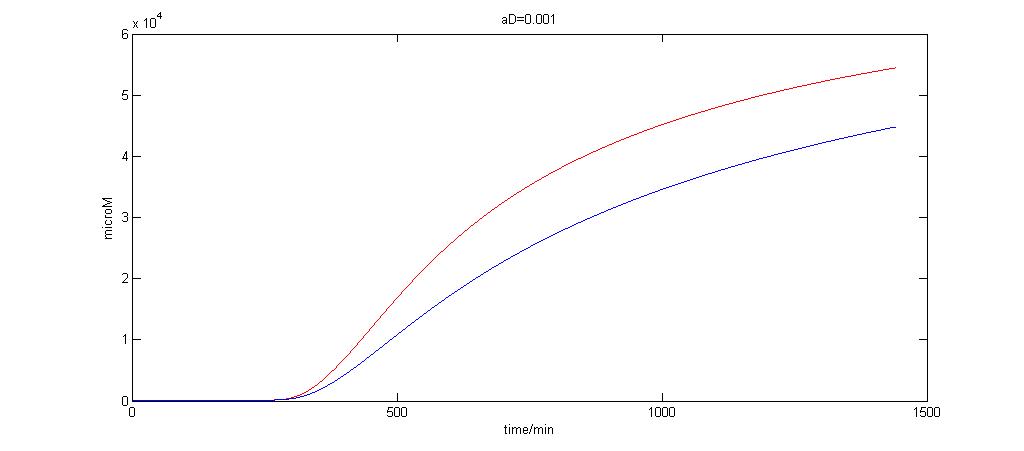
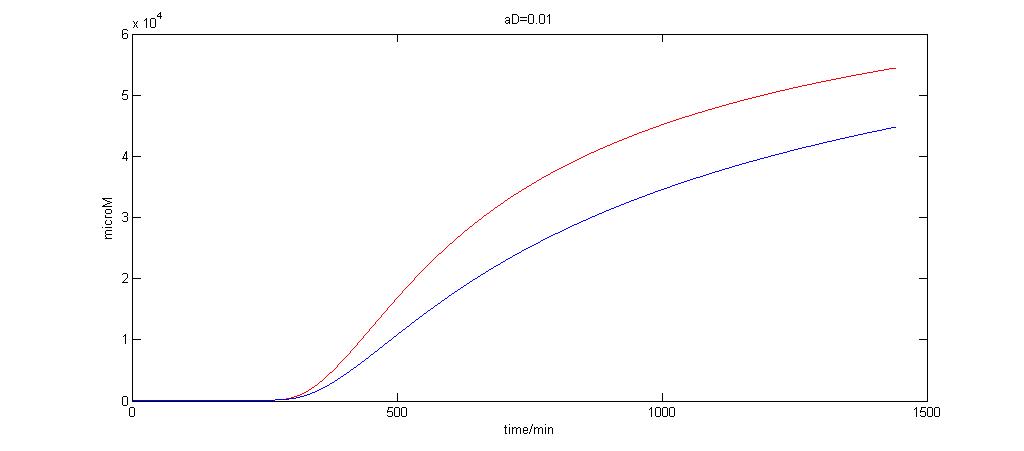
| + | In the following graphs, the red line represents the production of Lysis when both Autoinducer 2 and Iron ions are present. The blue line represents the graphs when only Autoinducer 2 is present. | ||
==Changing aD, nD=1== | ==Changing aD, nD=1== | ||
| Line 18: | Line 20: | ||
Graph of aD=0.01<br> | Graph of aD=0.01<br> | ||
[[Image:nd=1AD=0.01.jpg|600px| aD=0.01]]<br> | [[Image:nd=1AD=0.01.jpg|600px| aD=0.01]]<br> | ||
| + | |||
| + | We observe that when nD = 1, changing aD has no significant effect to Lysis protein production. Also | ||
==Changing aD, nD=10== | ==Changing aD, nD=10== | ||
| Line 26: | Line 30: | ||
Graph of aD=0.001<br> | Graph of aD=0.001<br> | ||
[[Image:nd=10AD=0.001.jpg|600px| aD=0.001]]<br> | [[Image:nd=10AD=0.001.jpg|600px| aD=0.001]]<br> | ||
| + | |||
| + | The graph presents a range of values aD can take on when nD = 10. As we can see, changing the values of aD has no effect on Lysis protein production as well. The difference between the | ||
| + | |||
==Changing aD, nD=100== | ==Changing aD, nD=100== | ||
| Line 36: | Line 43: | ||
Graph of aD=0.01<br> | Graph of aD=0.01<br> | ||
[[Image:nd=100AD=0.01.jpg|600px| aD=0.01]]<br> | [[Image:nd=100AD=0.01.jpg|600px| aD=0.01]]<br> | ||
| - | |||
| - | |||
Revision as of 03:23, 4 July 2008
|
Contents |
Parameter aD analysis
In the following graphs, the red line represents the production of Lysis when both Autoinducer 2 and Iron ions are present. The blue line represents the graphs when only Autoinducer 2 is present.
Changing aD, nD=1
We observe that when nD = 1, changing aD has no significant effect to Lysis protein production. Also
Changing aD, nD=10
The graph presents a range of values aD can take on when nD = 10. As we can see, changing the values of aD has no effect on Lysis protein production as well. The difference between the
Changing aD, nD=100
Graph of aD=0.01
 "
"

