Team:NTU-Singapore/Modelling/Parameter/LysisaF
From 2008.igem.org
(Difference between revisions)
Lalala8585 (Talk | contribs) (New page: <html><link rel="stylesheet" href="http://greenbear88.googlepages.com/ntu_igem.css" type="text/css"></html> <div id="header">{{User:Greenbear/sandbox/header}}</div> <div id="maincontent"...) |
Lalala8585 (Talk | contribs) |
||
| Line 6: | Line 6: | ||
[https://2008.igem.org/Team:NTU-Singapore/Modelling/Parameter Back to Parameter Estimation] | [https://2008.igem.org/Team:NTU-Singapore/Modelling/Parameter Back to Parameter Estimation] | ||
| + | =Parameter aF analysis= | ||
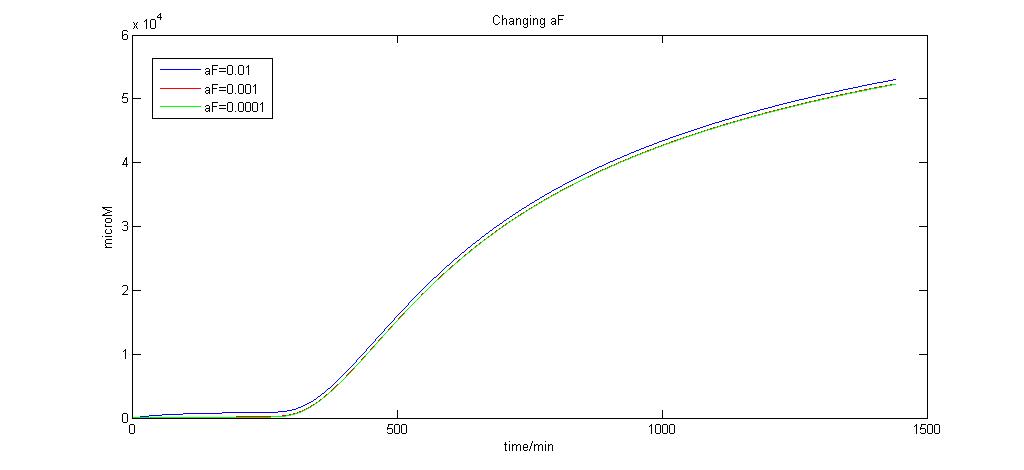
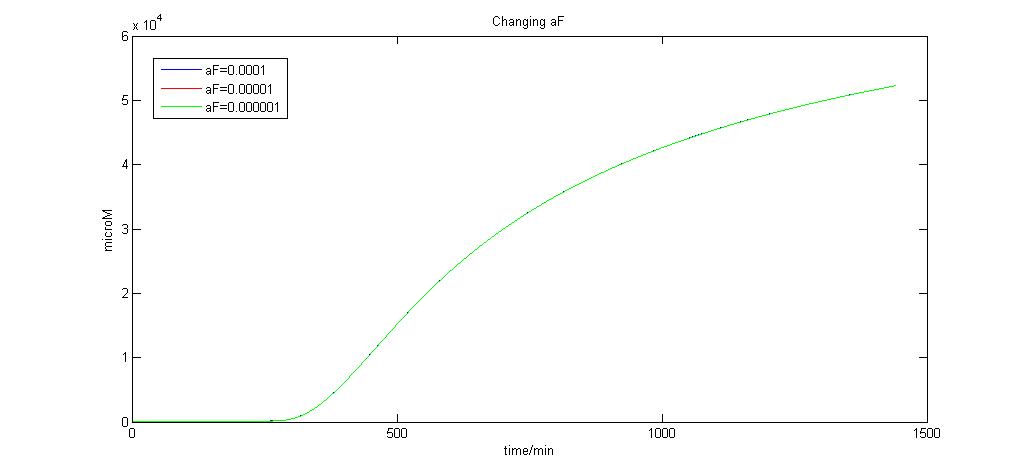
| + | Here we attempt to change aF over a range of values to observe how aF affects the production of the lysis protein. | ||
Graph of aF (0.01, 0.001, and 0.0001)<br> | Graph of aF (0.01, 0.001, and 0.0001)<br> | ||
| Line 13: | Line 15: | ||
Graph of aF (0.0001,0.00001 and 0.000001)<br> | Graph of aF (0.0001,0.00001 and 0.000001)<br> | ||
[[Image:Changing_aF2.jpg|850px| aF2]] | [[Image:Changing_aF2.jpg|850px| aF2]] | ||
| + | |||
| + | As we can see, when aF = 0.0001, any more reduction in its value by the order of 10 produces no significant change. We choose aF to be 0.0001 for this reason since it is the limiting value. | ||
Revision as of 03:31, 4 July 2008
|
Parameter aF analysis
Here we attempt to change aF over a range of values to observe how aF affects the production of the lysis protein.
As we can see, when aF = 0.0001, any more reduction in its value by the order of 10 produces no significant change. We choose aF to be 0.0001 for this reason since it is the limiting value. "
"


