Team:Caltech/Project/Vitamins
From 2008.igem.org
(→Folate Assay Results for folB, folKE, and folBKE) |
(→Folate Assay Results for folB, folKE, and folBKE) |
||
| Line 51: | Line 51: | ||
===Folate Assay Results for ''folB'', ''folKE'', and ''folBKE''=== | ===Folate Assay Results for ''folB'', ''folKE'', and ''folBKE''=== | ||
| - | |||
| - | |||
| - | |||
| - | |||
The experimental setup included running a standard curve with known amounts of folic acid (0-10ng) simultaneously with the samples, in order to have the same basis for comparison. The hope was that the standard curve growth OD values would correspond with known concentrations, and so sample concentrations could be interpolated based upon the standard. For ''folKE'' and ''folBKE,'' which were in constitutive high-copy plasmids, these genes were tested with and without the addition of 500 ng of pABA during inoculation. ''folB'', which is in an inducible copy plasmid, it was tested induced high-copy as well as uninduced low-copy, with and without 500 ng of pABA during inoculation. Folate levels were assayed based on protocol mentioned above[https://2008.igem.org/Team:Caltech/Protocols/Folate_assay]. | The experimental setup included running a standard curve with known amounts of folic acid (0-10ng) simultaneously with the samples, in order to have the same basis for comparison. The hope was that the standard curve growth OD values would correspond with known concentrations, and so sample concentrations could be interpolated based upon the standard. For ''folKE'' and ''folBKE,'' which were in constitutive high-copy plasmids, these genes were tested with and without the addition of 500 ng of pABA during inoculation. ''folB'', which is in an inducible copy plasmid, it was tested induced high-copy as well as uninduced low-copy, with and without 500 ng of pABA during inoculation. Folate levels were assayed based on protocol mentioned above[https://2008.igem.org/Team:Caltech/Protocols/Folate_assay]. | ||
We assayed both the supernatant and the cell lysate, though only the supernatant had measurable results. As such, the following data contain only supernatant assay results. | We assayed both the supernatant and the cell lysate, though only the supernatant had measurable results. As such, the following data contain only supernatant assay results. | ||
| Line 62: | Line 58: | ||
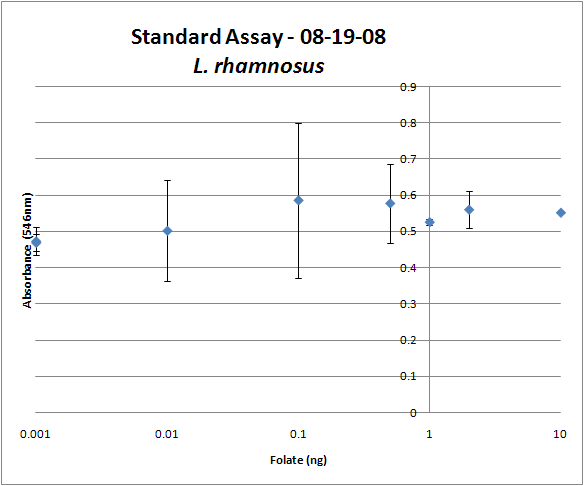
For Test #1, only ''folKE'' and ''folBKE'' were tested, as ''folB'' needed a longer incubation time. The standard curve and growth results are shown on the right. First off, it is clear that the standard curve is pretty much useless in terms of linearity and relative growth compared to the samples. Although the reasons for this were unclear, the growth data for the samples are very encouraging since the relative folate levels match what we would expect. We see that the addition of 500 ng of pABA during inoculation dramatically increases overall folate levels for both ''folKE'' and ''folBKE'' relative to the samples without pABA. If ''folKE'' and ''folBKE'' folate levels are compared, it appears that overexpression of only ''folKE'' with pABA produces more folate than overexpression of both ''folB'' and ''folKE''. Furthermore, adding pABA to the wild type controls did not affect growth at all, suggesting that the assay bacteria ''L. rhamnosus'' was not metabolizing the extra pABA. The extremely high OD values for all the samples were possibly the result of not completely washing out all of the culture media prior to adding the ''L. rhamnosus'' to the assay samples. | For Test #1, only ''folKE'' and ''folBKE'' were tested, as ''folB'' needed a longer incubation time. The standard curve and growth results are shown on the right. First off, it is clear that the standard curve is pretty much useless in terms of linearity and relative growth compared to the samples. Although the reasons for this were unclear, the growth data for the samples are very encouraging since the relative folate levels match what we would expect. We see that the addition of 500 ng of pABA during inoculation dramatically increases overall folate levels for both ''folKE'' and ''folBKE'' relative to the samples without pABA. If ''folKE'' and ''folBKE'' folate levels are compared, it appears that overexpression of only ''folKE'' with pABA produces more folate than overexpression of both ''folB'' and ''folKE''. Furthermore, adding pABA to the wild type controls did not affect growth at all, suggesting that the assay bacteria ''L. rhamnosus'' was not metabolizing the extra pABA. The extremely high OD values for all the samples were possibly the result of not completely washing out all of the culture media prior to adding the ''L. rhamnosus'' to the assay samples. | ||
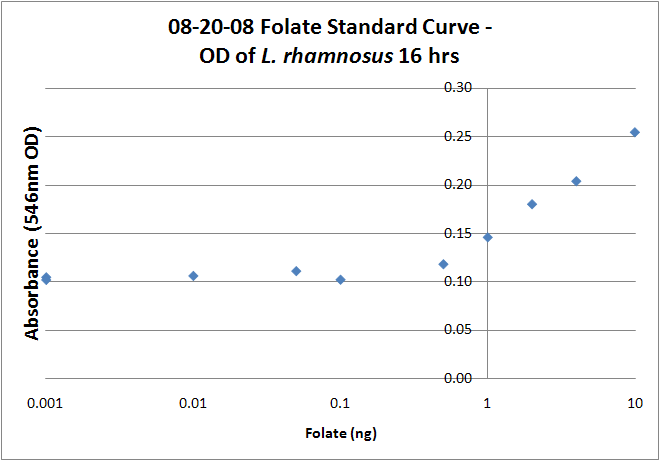
| + | [[Image:08-20-08 Folate Assay Std 16 hrs.png|thumb|left|Test #2: Folate Standard Assay. A beautiful linear range between .1 and 1 ng can be seen, but overall growth does not correspond to sample growth. Could we be saturating the standard?]] | ||
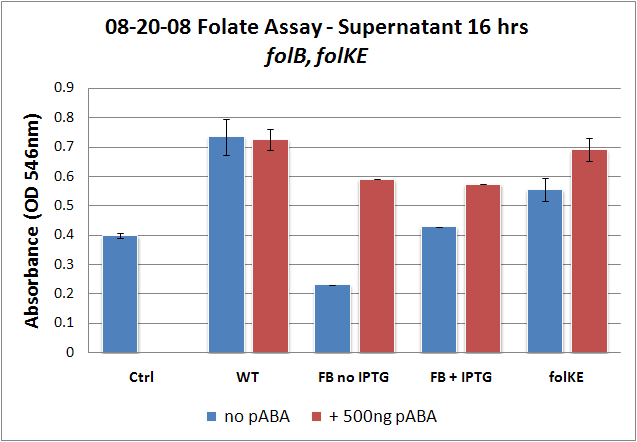
| + | [[Image:08-20-08 Folate Assay supernatant 16 hrs folKE, BKE.png|thumb|none|Test #2: Folate Assay Results with ''folKE'' and ''folBKE''. Although the wild type growth is mystifying, the folate levels for ''folKE'' and ''folBKE'' exhibit the same trends as before, which are: increased folate with addition of pABA, and ''folKE'' + pABA producing more folate than ''folBKE'' + pABA.]] | ||
| - | When we repeated the assay in duplicate, this time on ''folB'' as well, we were able to observe the same trends in growth with and without the addition of pABA. In addition, the standard curve came out perfectly linear in the expected range from .1 - 1ng. However, the growth OD for the standard curve again did not correspond with sample growth, and so we were again unable to estimate the folate concentrations in our samples. | + | When we repeated the assay in duplicate(above figures), this time on ''folB'' as well, we were able to observe the same trends in growth with and without the addition of pABA. In addition, the standard curve came out perfectly linear in the expected range from .1 - 1ng. However, the growth OD for the standard curve again did not correspond with sample growth, and so we were again unable to estimate the folate concentrations in our samples. |
Again, we see that for ''folKE'' and ''folBKE'', the addition of pABA does increase total folate levels, though not as dramatically as before. Overexpression of ''folKE'' alone with pABA continues to produce more folate than overexpression of ''folBKE''. The rampant growth of the wild type control is disconcerting, but wild type folate production again appears to be unaffected by the addition of pABA. Furthermore, folate levels for ''folKE'' and ''folBKE'' are still higher than the control where ''L. rhamnosus'' was added to only media without supernatant. | Again, we see that for ''folKE'' and ''folBKE'', the addition of pABA does increase total folate levels, though not as dramatically as before. Overexpression of ''folKE'' alone with pABA continues to produce more folate than overexpression of ''folBKE''. The rampant growth of the wild type control is disconcerting, but wild type folate production again appears to be unaffected by the addition of pABA. Furthermore, folate levels for ''folKE'' and ''folBKE'' are still higher than the control where ''L. rhamnosus'' was added to only media without supernatant. | ||
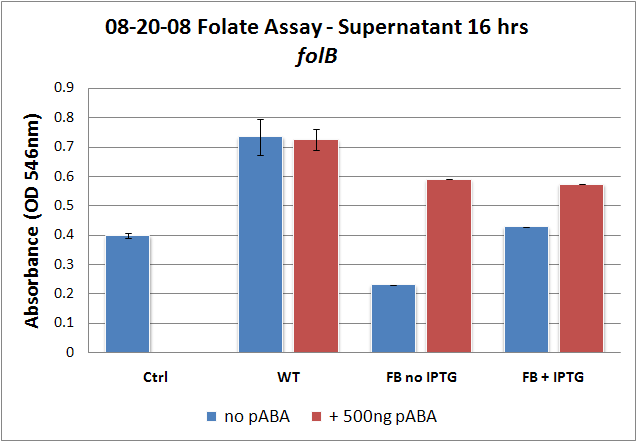
| + | [[Image:08-20-08 Folate Assay supernatant 16 hrs folB.png|thumb|center|Test #2: Folate Assay Results with ''folB''. ''folB'' was test in low and high copy since it is in an inducible-copy plasmid.]] | ||
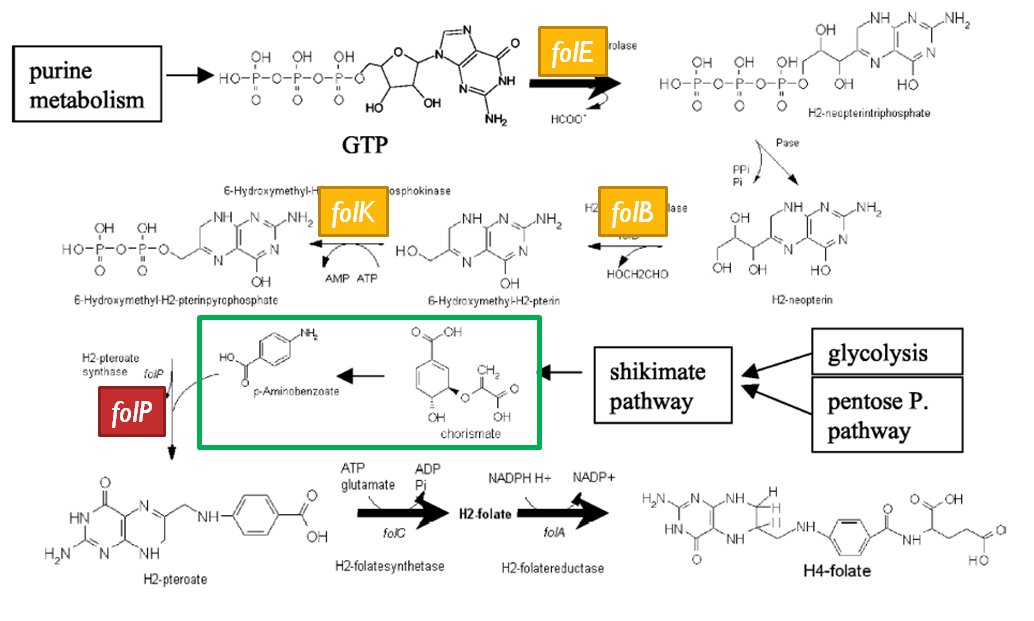
| + | [[Image:bottleneck.png|thumb|right|Increasing the flux of both pathways upstream of pABA integration into the pterin (derived from GTP) component of folate may have created a bottleneck. Unfortunately we were unable to test this hypothesis since we could not overexpress ''folP''.]] | ||
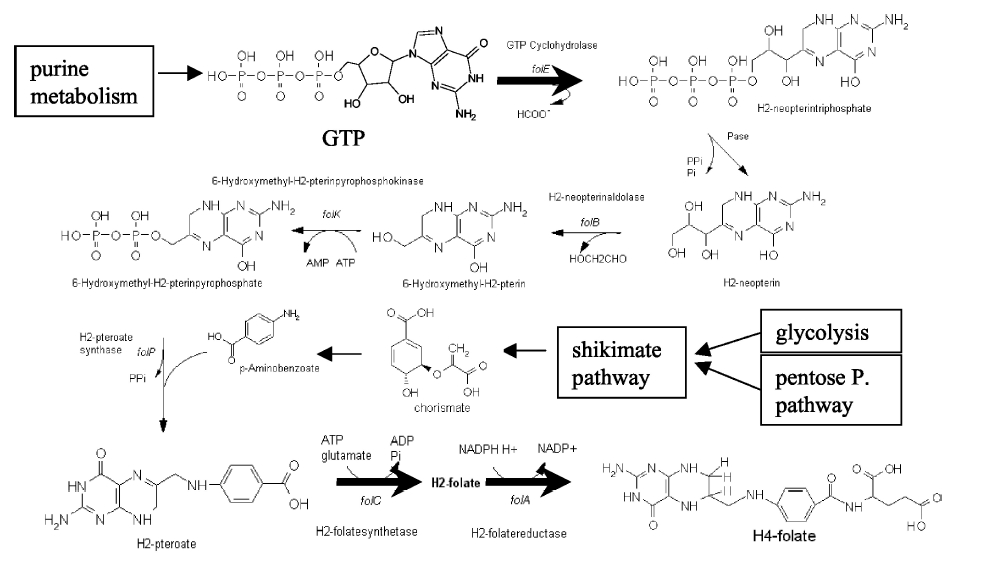
And what of ''folB''? Recall that ''folB'' was the only gene to be successfully cloned into an inducible-copy plasmid, and so it was tested both induced and uninduced. The folate levels in the induced sample (high-copy) are higher than in the uninduced (low-copy) sample, which is consistent with what we would expect. The addition of pABA to both induced and uninduced increases relative levels of folate, which is also consistent. However, the interesting thing to note is that folate levels for the +pABA samples are the ''same'' for induced and uninduced. Of course, given the small sample size, this could just be due to variability, but it could also suggest that folate production hit an upper rail. This explanation seems even more likely if we reconsider the folate biosynthesis pathway (shown again to the right), and we see that ''folB'' and ''folKE'' are both located upstream of actual integration of pABA into the molecule, accomplished by ''folP''. It is very possible that we are increasing the flux of both pathways going into the ''folP'' junction, but as we were unable to overexpress ''folP'' as well, we may have created a bottleneck. | And what of ''folB''? Recall that ''folB'' was the only gene to be successfully cloned into an inducible-copy plasmid, and so it was tested both induced and uninduced. The folate levels in the induced sample (high-copy) are higher than in the uninduced (low-copy) sample, which is consistent with what we would expect. The addition of pABA to both induced and uninduced increases relative levels of folate, which is also consistent. However, the interesting thing to note is that folate levels for the +pABA samples are the ''same'' for induced and uninduced. Of course, given the small sample size, this could just be due to variability, but it could also suggest that folate production hit an upper rail. This explanation seems even more likely if we reconsider the folate biosynthesis pathway (shown again to the right), and we see that ''folB'' and ''folKE'' are both located upstream of actual integration of pABA into the molecule, accomplished by ''folP''. It is very possible that we are increasing the flux of both pathways going into the ''folP'' junction, but as we were unable to overexpress ''folP'' as well, we may have created a bottleneck. | ||
Revision as of 20:15, 31 August 2008
|
People
|
{{{Content}}} |
</div>
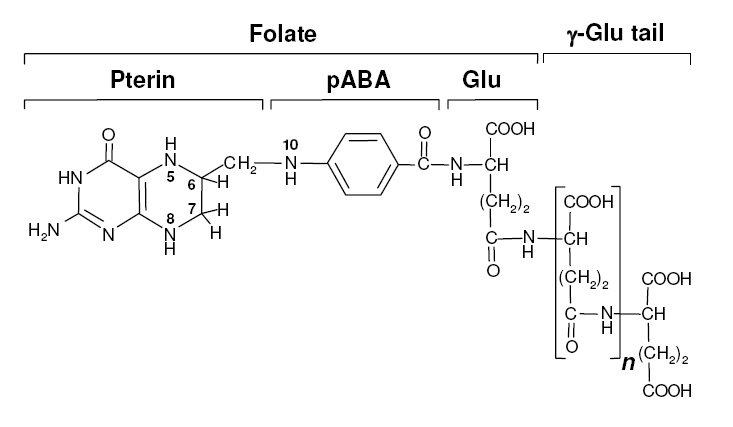
Background Information on FolateFolate, the generic term for the various forms of Vitamin B9, is an essential vitamin because it is heavily involved in amino acid synthesis as well as single-carbon transfer reactions. Folate deficiencies in women can result in birth defects such as neural tube defects and other spinal cord malformations. As important as folate is, humans are unable to produce folate, and so must obtain it from eating foods such as green leafy vegetables or folate-fortified cereals sybesma1. An engineered strain of bacteria that would constantly release folate into the gut would reduce the need to fortify breads and cereals with folate, as well as reduce folate-related birth defects in regions with little access to folate-containing foods. In addition to all the reasons stated above, folate is an ideal vitamin to be produced in the gut because, unlike many other vitamins, it has been shown to be absorbed in physiologically relevant quantities in the large intestineasrar. Structurally, folate consists of three main parts: pteridine, p-aminobenzoic acid (pABA), and L-glutamate.
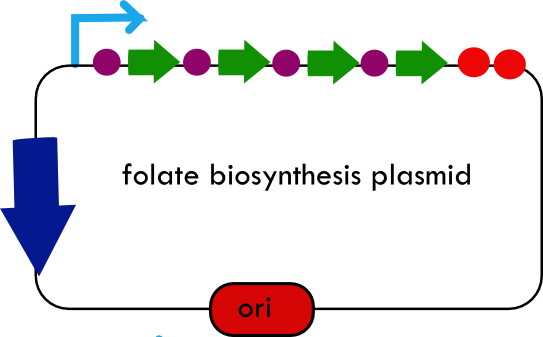
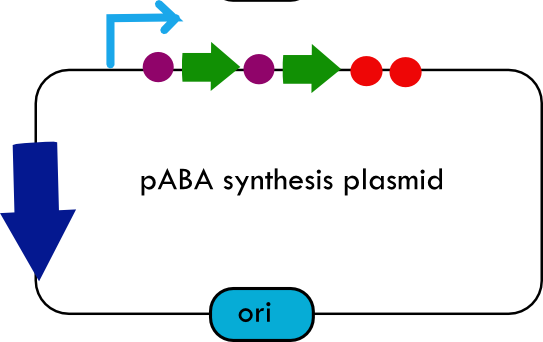
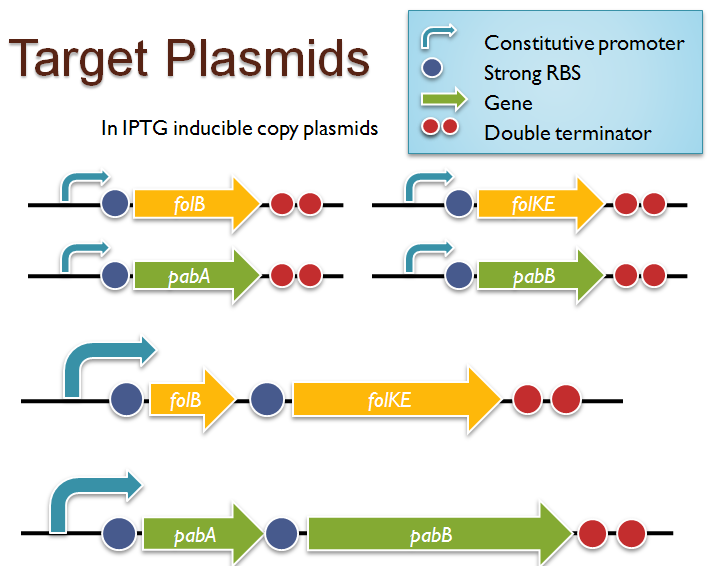
Folate Biosynthesis PathwayAlthough folate is naturally produced in E.coli, the folate biosynthesis pathway in the bacteria Lactococcus lactis has been more heavily characterized and studied. There are six major enzymes involved in folate synthesis, which, in L.lactis, are contained in five genes: folB, folKE, folP, folC, and folAsybesma1. The first four, which we have chosen to focus on, are located in a gene cluster approximately 4.4kb long. We’ve chosen not to focus on folA for the time being because folA encodes an enzyme which turns one form of folate (dihydrofolate) into another form of folate(tetrahydrofolate). Since our assay would detect both types of folate as part of the total folate production, folA was not a prime target for overexpression of folate. In previous studies, this folate gene cluster has been successfully transformed into the folate-consuming bacteria L.gasseri, turning the bacteria in to folate-producerswegkamp1. Therefore, we have chosen to also use the folate operon from L.lactis, which also offers the additional benefit of removing the operon from its natural regulatory context. Our strategy is to clone the entire folate operon from the L.lactis genome and to transform the entire operon into E.coli. However, because we are unsure of whether or not the ribosomal binding sites (RBS) within the L.lactis operon would work in E.coli, we are also going to unpack the operon by cloning each of the four genes individually, placing them behind E.coli RBSs, and then recombine them into a single empty BioBricks™ plasmid. In addition to the main folate operon, we will also be experimenting with overexpression of the para-aminobenzoic acid (pABA) synthesis pathway from chorismate. Wegkamp et al. have shown that in order to increase overall total levels of folate, both the pABA synthesis genes and certain folate production genes need to be overexpressedwegkamp2. The pABA pathway involves three genes, pabA, pabB, and pabC – though in L.lactis, pabB is actually a fusion gene encoding for both pabB and pabCwegkamp2. System DesignThe overall system design for testing folate production in E.coli is to construct two plasmids – one for the folate biosynthesis pathway, and one for the pABA synthesis pathway. In addition to ensuring that the plasmids are complementary, each plasmid would need to contain a different variable copy origin of replication, which would be low copy by default, but can be switched to high copy via the addition of Isopropyl β-D-1-thiogalactopyranoside (IPTG)to the media. This will allow us to test overexpression of each plasmid separately. In addition, each plasmid will contain a constitutive promoter, since we would want folate to be produced constantly. The purple dots represent ribosomal binding sites (RBS), followed by the gene (green arrow), and eventually terminating in a double stop (TAATAA) sequence, as regulated by the Registry of Standard Biological Parts. Folate Detection MethodsWe will be detecting folate production, and thus the relative success of our engineering efforts, via a microbiological assay involving the folate-dependent strain Lactobacillus rhamnosushorne. This assay involves first the characterization of a standard growth curve of L. rhamnosus given known quantities of folate present in the growth media. Once the standard curve has been established, then experimental growth levels, as quantified by spectrophotometry, can be interpolated. PABA concentrations will be measured via high performance liquid chromatography (HPLC) wegkamp2. Folate Microbiological Assay Protocol para-aminobenzoic acid (pABA) HPLC protocol ResultsModifications to System DesignWe were unable to successfully use PCR to clone out several of our goals: the entire folate gene cluster, folP, and folC. After analyzing the sequencing results of our other folate biosynthesis genes, we realized that the genetic sequences had several point mutations which indicated that we had a homologous, but not identical, genomic DNA than the one that we had based our PCR primer design off of. We believe that this homologous sequence could be the reason why we were unable to successfully extract folP, folC, and subsequently, the entire folate gene cluster (since folP and folC are the last two genes in the cluster) from the genomic DNA of L. lactis that we had ordered from ATCC. The revised target constructs are shown in the figure to the right. As a result, we continued forward with cloning for the four genes we were able to successfully extract: folB, folKE, pabA, and pabB. We still aimed to create individual constructs of each gene in the IPTG inducible-copy plasmid pSB2K3, as well as constructs with the two folate genes combined and with the two pABA synthesis genes combined. However, we had issues cloning our genes into the pSB2K3 + B0015 terminator construct, and so switched to completing the constructs in the high copy plasmid pSB1AK3 + b0015 terminator. As such, our final constructs are: folB in pSB2K3, and folKE, pabA, folB+folKE, and pabB in pSB1AK3. Although the last two were not yet sequence confirmed, we pushed ahead to testing due to time constraints. The goal was to detect higher folate levels with overexpression of folB, folKE, and folBKE with pABA spiked in. Previous studies on folate overexpression have shown that both folate synthesis and pABA synthesis genes need to be overexpressed simultaneously in order to increase total folate levels Wegkamp. As such, tests were done with and without the spiking in of pABA during the E.coli inoculation. Folate Assay Results for folB, folKE, and folBKEThe experimental setup included running a standard curve with known amounts of folic acid (0-10ng) simultaneously with the samples, in order to have the same basis for comparison. The hope was that the standard curve growth OD values would correspond with known concentrations, and so sample concentrations could be interpolated based upon the standard. For folKE and folBKE, which were in constitutive high-copy plasmids, these genes were tested with and without the addition of 500 ng of pABA during inoculation. folB, which is in an inducible copy plasmid, it was tested induced high-copy as well as uninduced low-copy, with and without 500 ng of pABA during inoculation. Folate levels were assayed based on protocol mentioned above[1]. We assayed both the supernatant and the cell lysate, though only the supernatant had measurable results. As such, the following data contain only supernatant assay results. 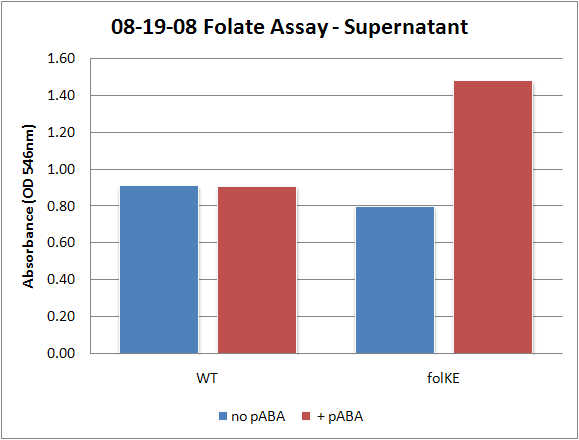 Test #1: Relative folate levels for folKE and folBKE compared to E. coli wild type. Here we see encouraging confirmation of all the expected trends - the addition of pABA during inoculation increases total folate levels but only in the samples with overexpression of our overexpressed folate constructs. For Test #1, only folKE and folBKE were tested, as folB needed a longer incubation time. The standard curve and growth results are shown on the right. First off, it is clear that the standard curve is pretty much useless in terms of linearity and relative growth compared to the samples. Although the reasons for this were unclear, the growth data for the samples are very encouraging since the relative folate levels match what we would expect. We see that the addition of 500 ng of pABA during inoculation dramatically increases overall folate levels for both folKE and folBKE relative to the samples without pABA. If folKE and folBKE folate levels are compared, it appears that overexpression of only folKE with pABA produces more folate than overexpression of both folB and folKE. Furthermore, adding pABA to the wild type controls did not affect growth at all, suggesting that the assay bacteria L. rhamnosus was not metabolizing the extra pABA. The extremely high OD values for all the samples were possibly the result of not completely washing out all of the culture media prior to adding the L. rhamnosus to the assay samples. When we repeated the assay in duplicate(above figures), this time on folB as well, we were able to observe the same trends in growth with and without the addition of pABA. In addition, the standard curve came out perfectly linear in the expected range from .1 - 1ng. However, the growth OD for the standard curve again did not correspond with sample growth, and so we were again unable to estimate the folate concentrations in our samples. Again, we see that for folKE and folBKE, the addition of pABA does increase total folate levels, though not as dramatically as before. Overexpression of folKE alone with pABA continues to produce more folate than overexpression of folBKE. The rampant growth of the wild type control is disconcerting, but wild type folate production again appears to be unaffected by the addition of pABA. Furthermore, folate levels for folKE and folBKE are still higher than the control where L. rhamnosus was added to only media without supernatant. And what of folB? Recall that folB was the only gene to be successfully cloned into an inducible-copy plasmid, and so it was tested both induced and uninduced. The folate levels in the induced sample (high-copy) are higher than in the uninduced (low-copy) sample, which is consistent with what we would expect. The addition of pABA to both induced and uninduced increases relative levels of folate, which is also consistent. However, the interesting thing to note is that folate levels for the +pABA samples are the same for induced and uninduced. Of course, given the small sample size, this could just be due to variability, but it could also suggest that folate production hit an upper rail. This explanation seems even more likely if we reconsider the folate biosynthesis pathway (shown again to the right), and we see that folB and folKE are both located upstream of actual integration of pABA into the molecule, accomplished by folP. It is very possible that we are increasing the flux of both pathways going into the folP junction, but as we were unable to overexpress folP as well, we may have created a bottleneck. para-Aminobenzoic Acid (pABA) HPLC Assay Results for pabA and pabBConclusions Thus FarRelevant Registry PartsBasic Parts
Construction Intermediates
Composite Parts
References<biblio>
</biblio> |
 "
"

