Team:NTU-Singapore/Wetlab/Materials and Equipment
From 2008.igem.org
Lalala8585 (Talk | contribs) |
Lalala8585 (Talk | contribs) (→Preparation of AI-2) |
||
| Line 47: | Line 47: | ||
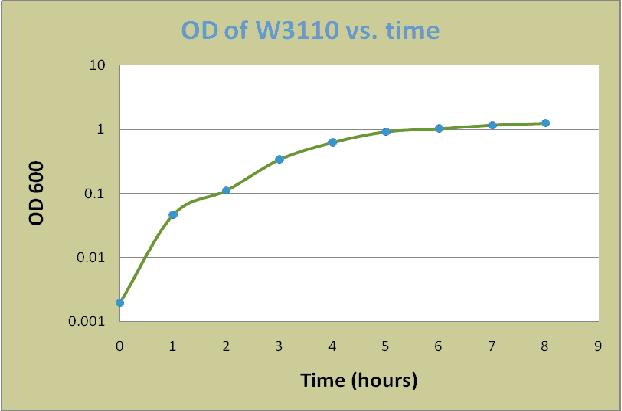
Based on the data, a graph of OD600 versus time was constructed as below: | Based on the data, a graph of OD600 versus time was constructed as below: | ||
| - | [[Image:ODW3110.JPG|center]]<br> | + | [[Image:ODW3110.JPG|center|thumb|800px|OD of W3110 vs time]]<br> |
Maximal AI-2 production activity is typically observed during mid- to late exponential phase (Surette, 1998). Therefore, 4ml of samples corresponding to 2, 3, 3.333, 3.667, 4, 6 time points were collected and centrifuged at 13,200 rpm for 10 min in a microcentrifuge to separate cell pellets from supernatants. Cleared supernatants were filtered using 0.2 µm pore size filters to remove unwanted big proteins. Supernatants were stored at -20oC. | Maximal AI-2 production activity is typically observed during mid- to late exponential phase (Surette, 1998). Therefore, 4ml of samples corresponding to 2, 3, 3.333, 3.667, 4, 6 time points were collected and centrifuged at 13,200 rpm for 10 min in a microcentrifuge to separate cell pellets from supernatants. Cleared supernatants were filtered using 0.2 µm pore size filters to remove unwanted big proteins. Supernatants were stored at -20oC. | ||
Revision as of 01:18, 25 October 2008
|
Contents |
Materials
Preparation of AI-2
Pure AI-2 is very difficult to harvest or synthesize. However, as a quorum sensing messenger, AI-2 is present in intercellular medium in considerable amount. In this project, AI-2 was indirectly harvested by obtaining cell supernatants at different time points of cell growth. Glucose was added to the growth medium as it promotes AI-2 production significantly (Liang Wang, 2005).
A colony of E. coli W3110 was grown overnight in LB for 16 hours at 37 oC. The overnight culture was then diluted in LB plus 0.8% glucose to an optical density at 600 nm (OD600) of 0.02. The cells were incubated at 37oC with shaking at 225 rpm in 500ml Erlenmeyer flask. Cell aliquots were removed at each time point for measurement of the OD600. The measured values were shown in the following table:
| Time (hrs) | OD of W3110 |
| 0 | 0.002 |
| 1 | 0.047 |
| 2 | 0.112 |
| 3 | 0.341 |
| 4 | 0.628 |
| 5 | 0.921 |
| 6 | 1.032 |
| 7 | 1.172 |
| 8 | 1.252 |
Based on the data, a graph of OD600 versus time was constructed as below:
Maximal AI-2 production activity is typically observed during mid- to late exponential phase (Surette, 1998). Therefore, 4ml of samples corresponding to 2, 3, 3.333, 3.667, 4, 6 time points were collected and centrifuged at 13,200 rpm for 10 min in a microcentrifuge to separate cell pellets from supernatants. Cleared supernatants were filtered using 0.2 µm pore size filters to remove unwanted big proteins. Supernatants were stored at -20oC.
Bacteria strains and media
Bacteria used in all the experiments were LuxS mutants derived from the wild type E coli strain W3110. By knocking out LuxS gene, the cells were unable to synthesize AI-2. As a result, lsrA promoter could only be induced in the presence of external AI-2 produced by other bacteria rather than the host cells. LuxS mutants were first made chemically competent in order to be able to take in biobrick plasmids during transformation.
The media used for overnight growth of cells were Luria-Bertani broth (LB). Cells were diluted in M9 media to an OD600 of 1 before ready to be read under Fluorescence Microplate Reader or Absorbance reader.
Plasmid construction
All the plasmids used were in the standard biobrick form as regulated by the Biobricks Registry at MIT. The plasmid containing plsrA-YFP was used for characterization of lsrA promoter, while plsrA-celE7-Terminator plasmid (detection system) aimed to show the lysis of cells when exposed to AI-2.
| Insert | Vector | Subparts | Name in Registry |
| pLsrA-YFP | pSB1A3 | BBa_K117002 BBa_E0430 | BBa_K117008 |
| plsrA-celE7-Terminator | pSB1A3 | BBa_K117002 BBa_K117006 | BBa_K117010 |
Equipments
- Victor 3 multilabel reader was used to measure RFU value of yellow fluorescent protein (YFP) using excitation filter of 490 nm and emission filter of 535 nm.
- Absorbance-meter was used to measure OD600 values. "
"

