Team:NTU-Singapore/Modelling/Parameter/LysisaD
From 2008.igem.org
m |
Lalala8585 (Talk | contribs) |
||
| Line 3: | Line 3: | ||
<div id="header">{{User:Greenbear/sandbox/header}}</div> | <div id="header">{{User:Greenbear/sandbox/header}}</div> | ||
| - | <div id="maincontent" style="margin-top: | + | <div id="maincontent" style="margin-top:100px;"> |
| + | <html> | ||
| + | <div id="arrow"> | ||
| + | <a href="https://2008.igem.org/Team:NTU-Singapore/Modelling/Parameter"> | ||
| + | <img src="https://static.igem.org/mediawiki/2008/2/28/Back_to_param2.png" | ||
| + | alt="Back to parameter estimation" | ||
| + | title="Back to parameter estiamtion"> | ||
| + | </a> | ||
| + | </div> | ||
| + | </html> | ||
| - | |||
| - | |||
=Parameter aD analysis= | =Parameter aD analysis= | ||
| Line 14: | Line 21: | ||
Graph of aD=0.00001<br> | Graph of aD=0.00001<br> | ||
| - | [[Image:nd=1AD=0.00001.jpg|600px| aD=0.00001]]<br> | + | [[Image:nd=1AD=0.00001.jpg|thumb|center|600px|Graph of aD=0.00001]]<br> |
Graph of aD=0.001<br> | Graph of aD=0.001<br> | ||
| - | [[Image:nd=1AD=0.001.jpg|600px| aD=0.001]]<br> | + | [[Image:nd=1AD=0.001.jpg|thumb|center|600px|Graph of aD=0.001]]<br> |
Graph of aD=0.01<br> | Graph of aD=0.01<br> | ||
| - | [[Image:nd=1AD=0.01.jpg|600px| aD=0.01]]<br> | + | [[Image:nd=1AD=0.01.jpg|thumb|center|600px|Graph of aD=0.01]]<br> |
We observe that when nD = 1, changing aD has no significant effect to Lysis protein production. Also there seems to be no difference between the two forms of Lysis protein production even under different situations. | We observe that when nD = 1, changing aD has no significant effect to Lysis protein production. Also there seems to be no difference between the two forms of Lysis protein production even under different situations. | ||
| Line 27: | Line 34: | ||
Graph of aD=0.0001<br> | Graph of aD=0.0001<br> | ||
| - | [[Image:nd=10AD=0.0001.jpg|600px| aD=0.0001]]<br> | + | [[Image:nd=10AD=0.0001.jpg|center|thumb|600px|Graph of aD=0.0001]]<br> |
Graph of aD=0.001<br> | Graph of aD=0.001<br> | ||
| - | [[Image:nd=10AD=0.001.jpg|600px| aD=0.001]]<br> | + | [[Image:nd=10AD=0.001.jpg|center|thumb|600px|Graph of aD=0.001]]<br> |
The graph presents a range of values aD can take on when nD = 10. As we can see, changing the values of aD has no effect on Lysis protein production as well. The difference between the Lysis protein production under the two different circumstances is now more obvious. | The graph presents a range of values aD can take on when nD = 10. As we can see, changing the values of aD has no effect on Lysis protein production as well. The difference between the Lysis protein production under the two different circumstances is now more obvious. | ||
| Line 37: | Line 44: | ||
==Changing aD, nD=100== | ==Changing aD, nD=100== | ||
Graph of aD=0.0001<br> | Graph of aD=0.0001<br> | ||
| - | [[Image:nd=100AD=0.0001.jpg|600px| aD=0.0001]]<br> | + | [[Image:nd=100AD=0.0001.jpg|thumb|center|600px|Graph of aD=0.0001]]<br> |
Graph of aD=0.001<br> | Graph of aD=0.001<br> | ||
| - | [[Image:nd=100AD=0.001.jpg|600px| aD=0.001]]<br> | + | [[Image:nd=100AD=0.001.jpg|thumb|center|600px|Graph of aD=0.001]]<br> |
Graph of aD=0.01<br> | Graph of aD=0.01<br> | ||
| - | [[Image:nd=100AD=0.01.jpg|600px| aD=0.01]]<br> | + | [[Image:nd=100AD=0.01.jpg|thumb|center|600px|Graph of aD=0.01]]<br> |
Here the difference in Lysis protein production is more pronounced and obvious. We understand from these different trends that aD has little or no significant impact on protein production and that nD will be the main deciding factor. | Here the difference in Lysis protein production is more pronounced and obvious. We understand from these different trends that aD has little or no significant impact on protein production and that nD will be the main deciding factor. | ||
Revision as of 01:54, 25 October 2008
|
Contents |
Parameter aD analysis
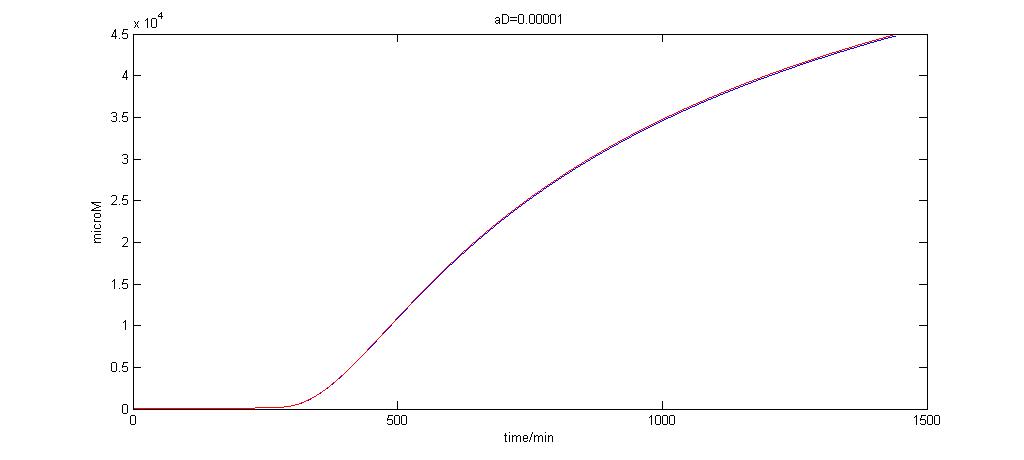
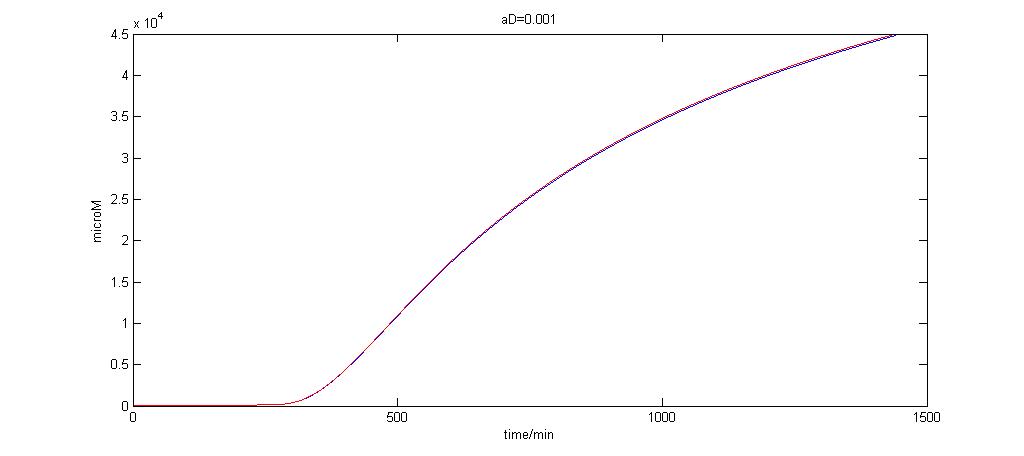
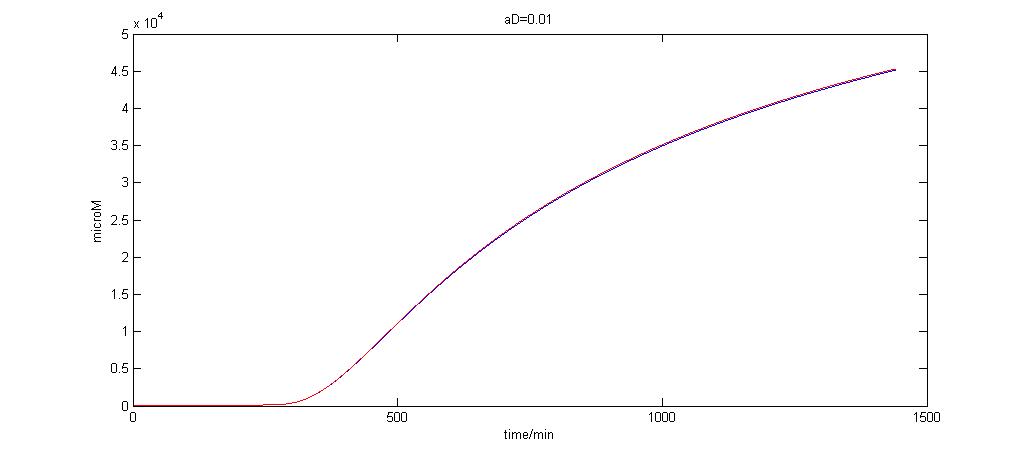
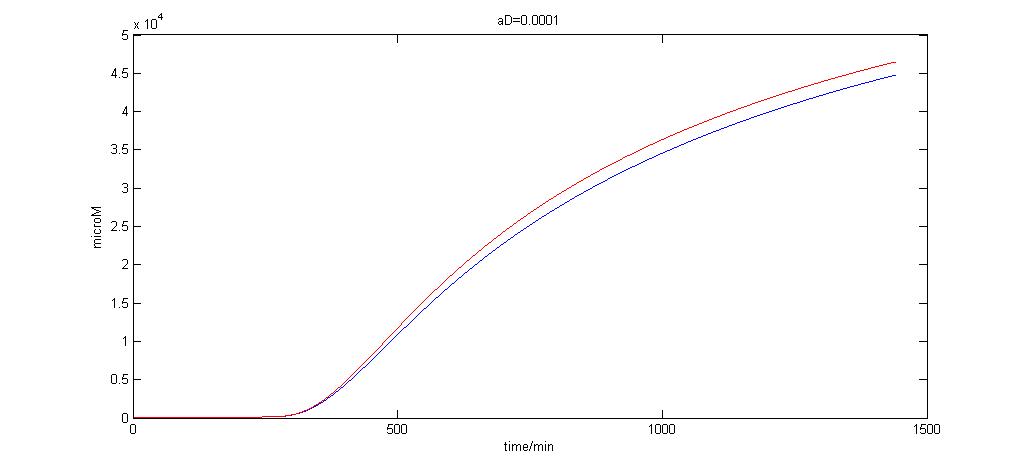
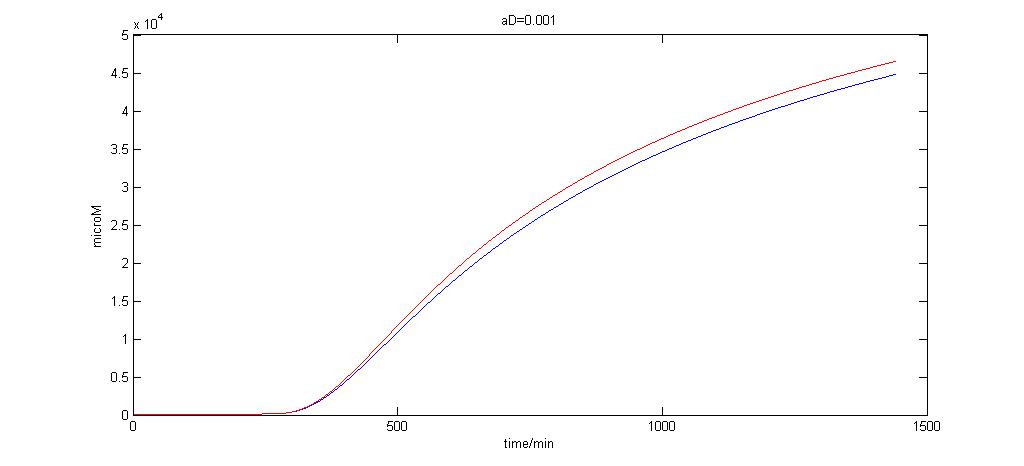
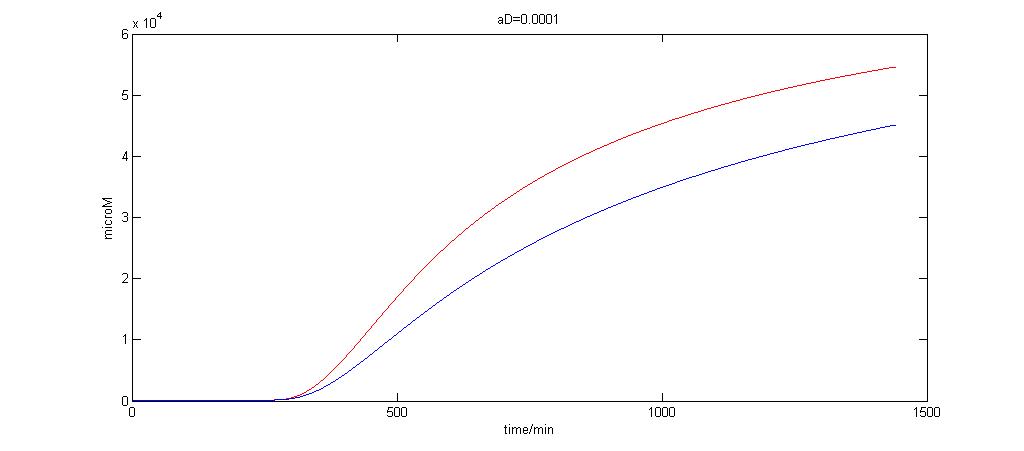
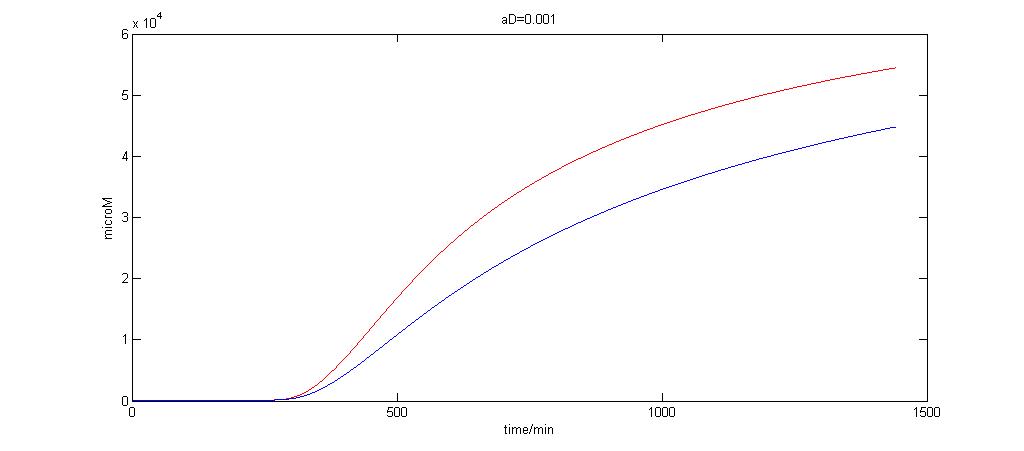
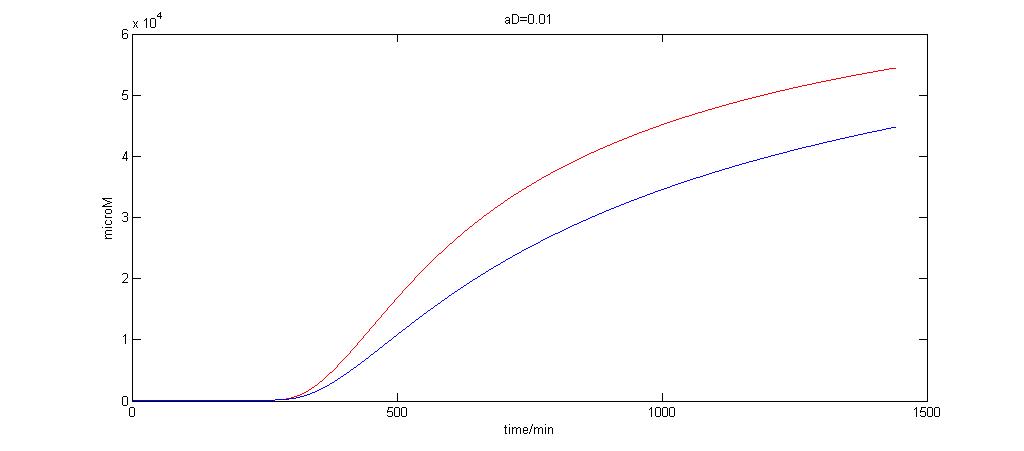
In the following graphs, the red line represents the production of Lysis when both Autoinducer 2 and Iron ions are present. The blue line represents the graphs when only Autoinducer 2 is present.
Changing aD, nD=1
Graph of aD=0.00001
Graph of aD=0.001
Graph of aD=0.01
We observe that when nD = 1, changing aD has no significant effect to Lysis protein production. Also there seems to be no difference between the two forms of Lysis protein production even under different situations.
Changing aD, nD=10
Graph of aD=0.0001
Graph of aD=0.001
The graph presents a range of values aD can take on when nD = 10. As we can see, changing the values of aD has no effect on Lysis protein production as well. The difference between the Lysis protein production under the two different circumstances is now more obvious.
Changing aD, nD=100
Graph of aD=0.0001
Graph of aD=0.001
Graph of aD=0.01
Here the difference in Lysis protein production is more pronounced and obvious. We understand from these different trends that aD has little or no significant impact on protein production and that nD will be the main deciding factor.
 "
"


