Team:NTU-Singapore/Modelling/Parameter/Lysisk3DE
From 2008.igem.org
(Difference between revisions)
Lalala8585 (Talk | contribs) |
Lalala8585 (Talk | contribs) |
||
| Line 3: | Line 3: | ||
<div id="header">{{User:Greenbear/sandbox/header}}</div> | <div id="header">{{User:Greenbear/sandbox/header}}</div> | ||
| - | |||
| - | + | <div id="maincontent" style="margin-top:100px;"> | |
| + | <html> | ||
| + | <div id="arrow"> | ||
| + | <a href="https://2008.igem.org/Team:NTU-Singapore/Modelling/Parameter"> | ||
| + | <img src="https://static.igem.org/mediawiki/2008/2/28/Back_to_param2.png" | ||
| + | alt="Back to parameter estimation" | ||
| + | title="Back to parameter estiamtion"> | ||
| + | </a> | ||
| + | </div> | ||
| + | </html> | ||
=Parameter k3DE analysis= | =Parameter k3DE analysis= | ||
| Line 13: | Line 21: | ||
==k3DE variation== | ==k3DE variation== | ||
k3DE = 0.00000001<br> | k3DE = 0.00000001<br> | ||
| - | [[Image:Varying_Iron(k3DE=0.00000001).jpg|850px| k3DE=0.00000001]]<br> | + | [[Image:Varying_Iron(k3DE=0.00000001).jpg|thumb|center|850px|Graph of k3DE=0.00000001]]<br> |
k3DE = 0.0000001<br> | k3DE = 0.0000001<br> | ||
| - | [[Image:Varying_Iron(k3DE=0.0000001).jpg|850px| k3DE=0.0000001]]<br> | + | [[Image:Varying_Iron(k3DE=0.0000001).jpg|thumb|center|850px|Graph of k3DE=0.0000001]]<br> |
k3DE = 0.000001<br> | k3DE = 0.000001<br> | ||
| - | [[Image:Varying_Iron(k3DE=0.000001).jpg|850px| k3DE=0.000001]]<br> | + | [[Image:Varying_Iron(k3DE=0.000001).jpg|thumb|center|850px|Grpah of k3DE=0.000001]]<br> |
k3DE = 0.00001<br> | k3DE = 0.00001<br> | ||
| - | [[Image:Varying_Iron(k3DE=0.00001).jpg|850px| k3DE=0.00001]]<br> | + | [[Image:Varying_Iron(k3DE=0.00001).jpg|thumb|center|850px|Graph of k3DE=0.00001]]<br> |
k3DE = 0.0001<br> | k3DE = 0.0001<br> | ||
| - | [[Image:Varying_Iron(k3DE=0.0001).jpg|850px| k3DE=0.0001]]<br> | + | [[Image:Varying_Iron(k3DE=0.0001).jpg|thumb|center|850px|Graph of k3DE=0.0001]]<br> |
k3DE = 0.001<br> | k3DE = 0.001<br> | ||
| - | [[Image:Varying_Iron(k3DE=0.001).jpg|850px| k3DE=0.001]]<br> | + | [[Image:Varying_Iron(k3DE=0.001).jpg|thumb|center|850px|Graph of k3DE=0.001]]<br> |
k3DE = 0.01<br> | k3DE = 0.01<br> | ||
| - | [[Image:Varying_Iron(k3DE=0.01).jpg|850px| k3DE=0.01]]<br> | + | [[Image:Varying_Iron(k3DE=0.01).jpg|thumb|center|850px|Graph of k3DE=0.01]]<br> |
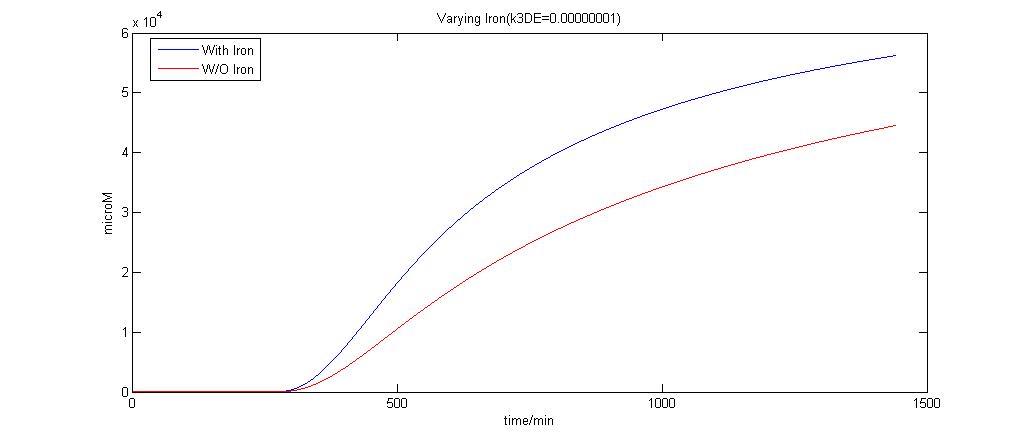
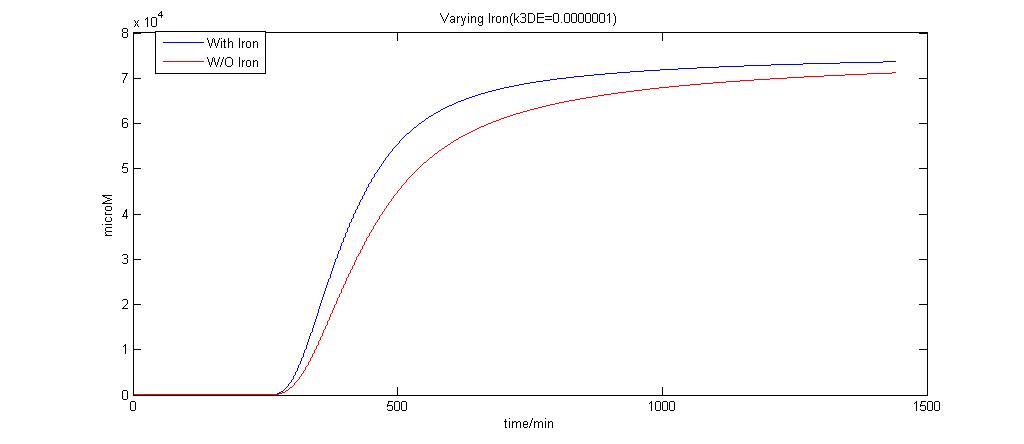
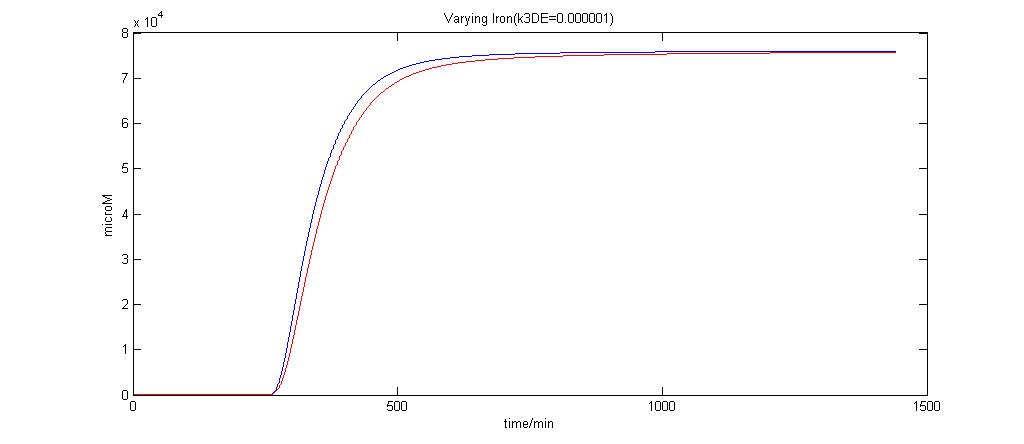
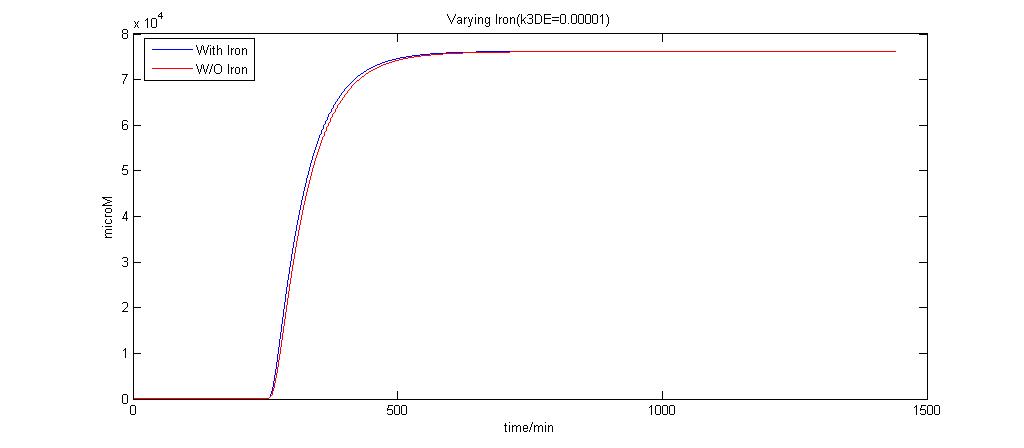
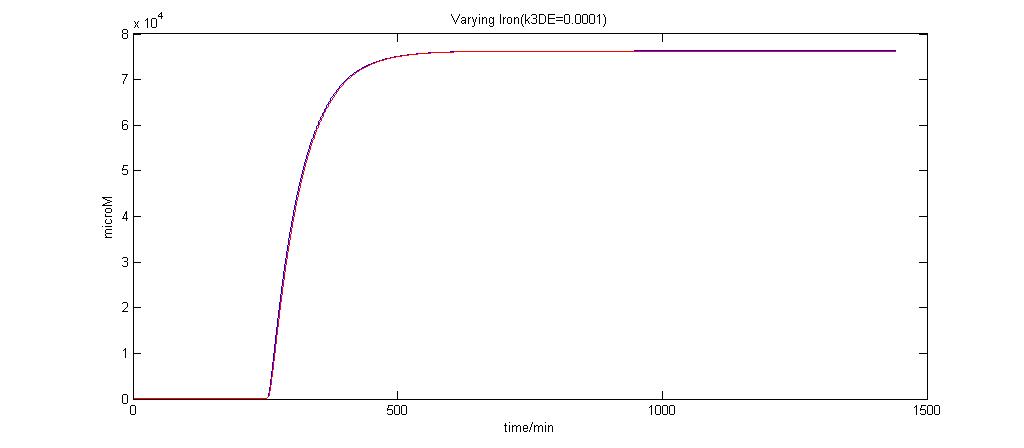
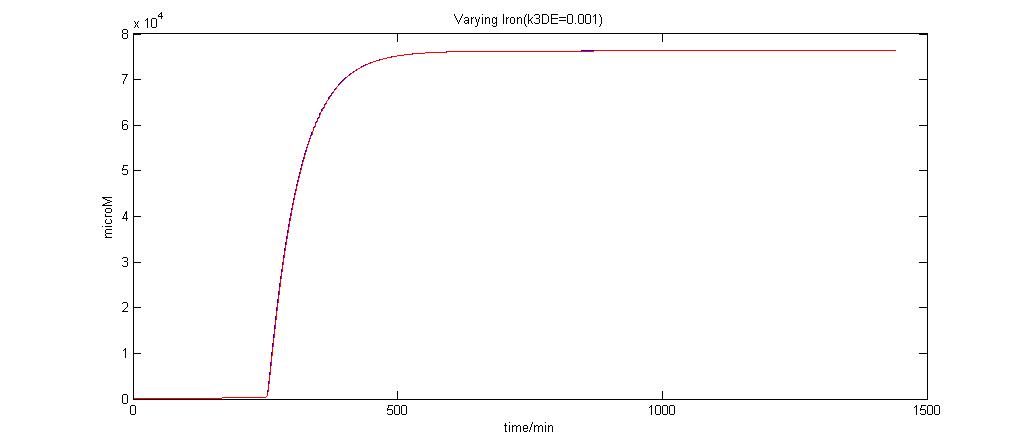
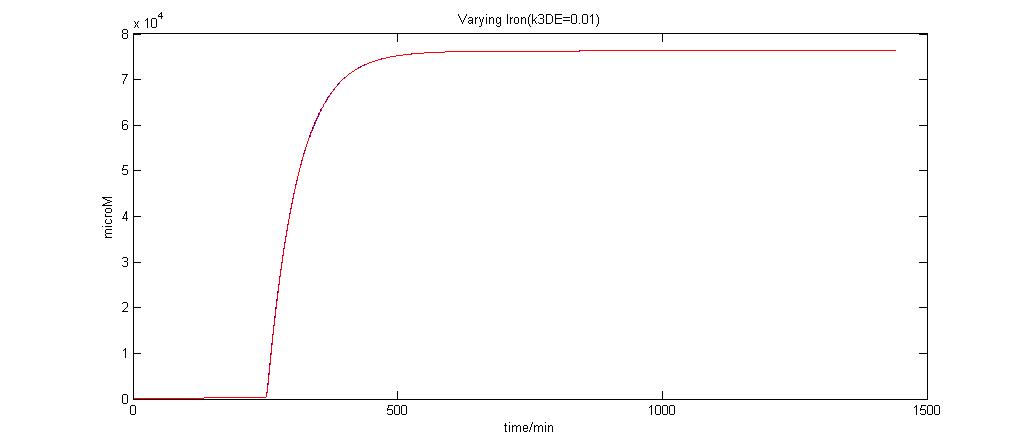
It is clear that when k3DE = 0.00000001 will there be a pronounced difference between the different situations. It is the main reason why this parameter was chosen to take on this value even though it is not very realistic. | It is clear that when k3DE = 0.00000001 will there be a pronounced difference between the different situations. It is the main reason why this parameter was chosen to take on this value even though it is not very realistic. | ||
Revision as of 02:02, 25 October 2008
|
Parameter k3DE analysis
In the graphs below, the blue lines represent the lysis protein production under iron induction alone. The red lines represent the production of lysis protein when no iron or Auto-inducer 2 is added.
k3DE variation
k3DE = 0.00000001
k3DE = 0.0000001
k3DE = 0.000001
k3DE = 0.00001
k3DE = 0.0001
k3DE = 0.001
k3DE = 0.01
 "
"


