Team:UCSF/Modeling
From 2008.igem.org
| Line 64: | Line 64: | ||
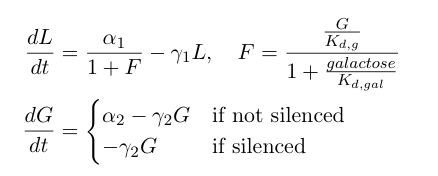
The first equation above describes the transcriptional repression leg of the switch, e.g. Gal80 represses the expression of LexA-Sir2. We've added an additional point of control here by including galactose as a possible input to "flip" the switch through repressing the transcriptional repression. The second equation describes the silencing by heterochromatin, where we are making the assumption that once the expected length of heterochromatin (as calculated from the probability distribution derived earlier in this section) is greater than a certain length threshold, the Gal80 gene is completely silenced and is no longer being expressed. | The first equation above describes the transcriptional repression leg of the switch, e.g. Gal80 represses the expression of LexA-Sir2. We've added an additional point of control here by including galactose as a possible input to "flip" the switch through repressing the transcriptional repression. The second equation describes the silencing by heterochromatin, where we are making the assumption that once the expected length of heterochromatin (as calculated from the probability distribution derived earlier in this section) is greater than a certain length threshold, the Gal80 gene is completely silenced and is no longer being expressed. | ||
| - | For a specific set of parameters, we can solve the differential equations in Matlab and plot the concentrations | + | For a specific set of parameters, we can solve the differential equations in Matlab and plot the concentrations as a function of time. |
| - | |||
| + | {| align=center | ||
| + | |width=550 align=center|[[Image:UCSFmodel_polymer5.png|center|500px]] | ||
| + | |- | ||
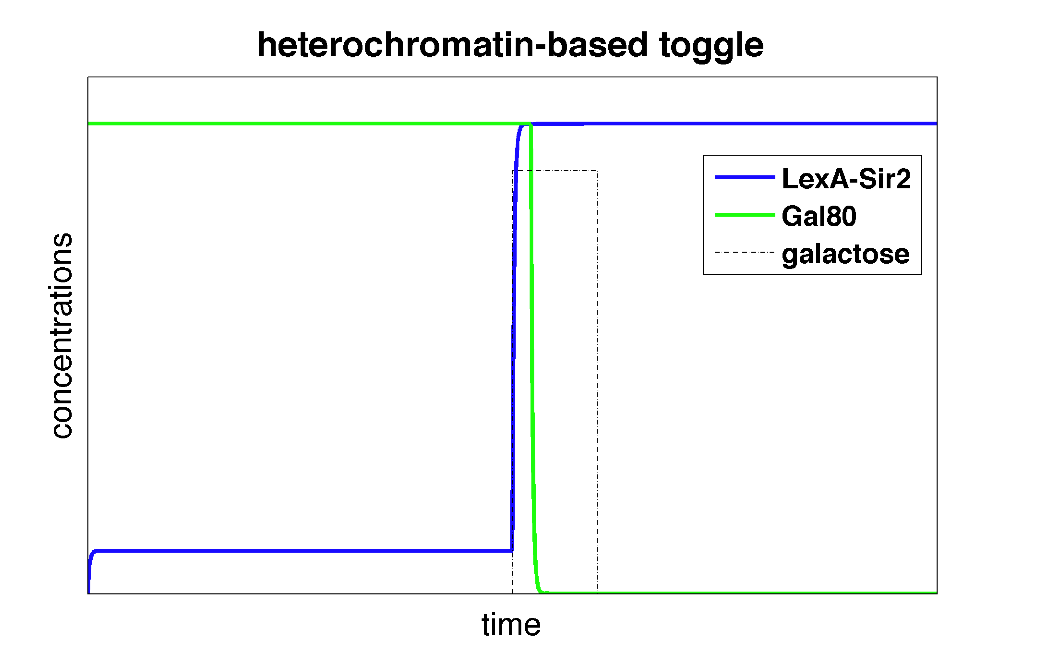
| + | |width=550 align=center|Figure 3: Time behavior of heterochromatin polymerization model. The system starts in a high Gal80/low LexA state. Upon addition of galactose, the toggle switch is flipped to a high LexA/low Gal80 state. | ||
| + | |} | ||
| + | |||
| + | In the plot above, we can see that initially, the system is set to a high Gal80/low LexA state. When we add the input galactose which represses the repression of Gal80 on LexA-Sir2, the system starts expressing LexA-Sir2 and eventually, the toggle switch is flipped to and remains in a state with high LexA/low Gal80. | ||
<br> | <br> | ||
Revision as of 22:56, 25 October 2008
As we mentioned before, our team is interested in cellular memory, when the cell state established after a transient stimuli can be "remembered" for longer times. One way to establish memory is using two repressor proteins that control the synthesis of each other, i.e. a "toggle" switch. So for the modeling portion of our iGEM project, we decided to focus on coming up with an intuitive model for a heterochromatin-based toggle switch that will allow us to show some of the advantages of using heterochromatin in building such synthetic circuits.
Starting Simple: Using the Gardner-Collins Toggle Switch Model
Previous work by the Collins group (Gardner, et al. Nature 2000) has shown that in a transcription-based circuit, at least one of the repressors needs to cooperatively repress transcription to achieve the bistability necessary for the formation of a toggle switch. In addition, the cooperativity needs to be much greater than 1 for a robust system, i.e. one that will generate a wide bistable region in the parameter space that is composed of different values for the two promoter strengths. Since heterochromatin formation, by nature, is a highly cooperative phenomenon, we plan to exploit this property as a tool for building our toggle switch.
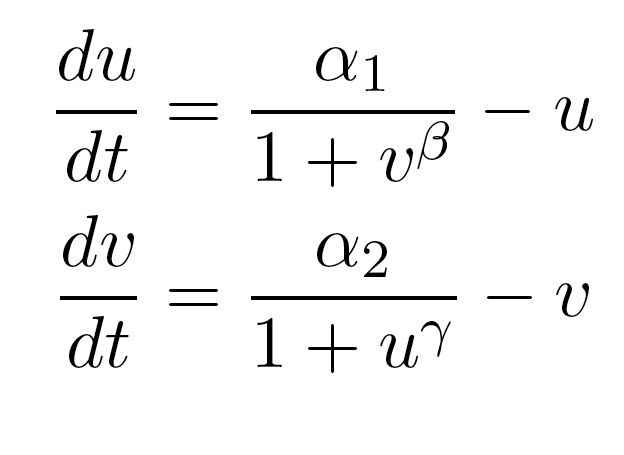
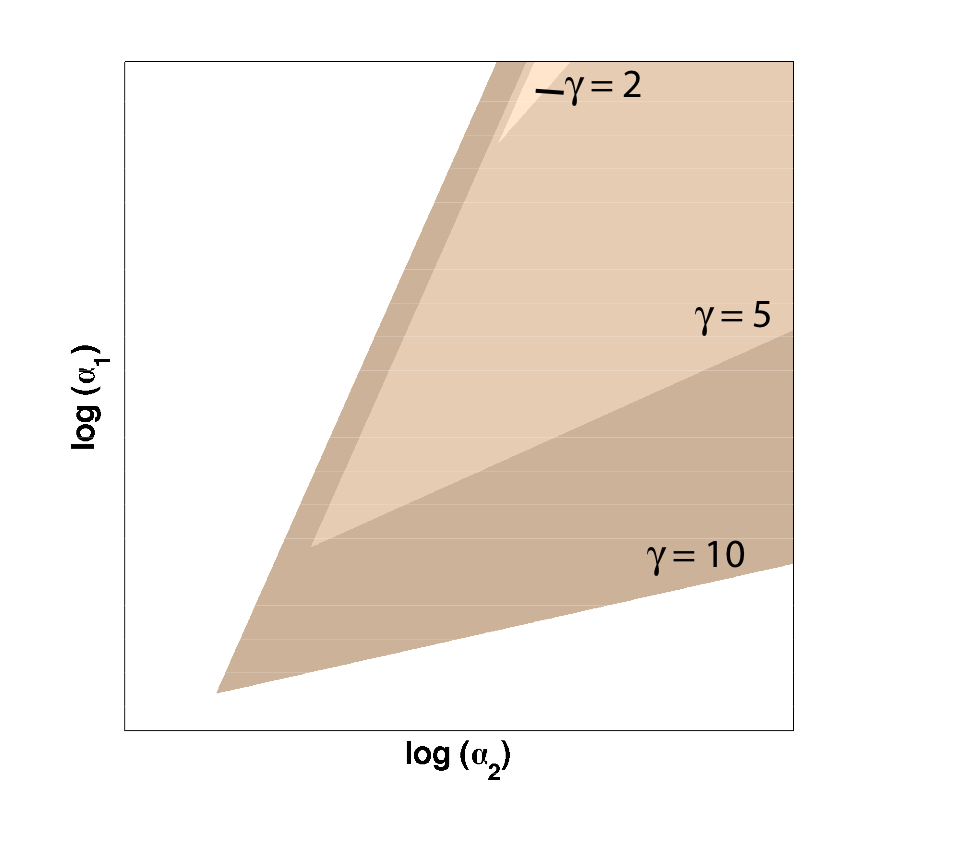
Because only one "leg" of our toggle switch would be regulated by heterochromatin and be highly cooperative, we first wanted to check how the system would behave with only one high cooperativity constant (and with the other constant set to 1). For this, we simply implemented the Gardner model in Matlab and plotted the resulting bistable regions:
| Figure 1: Bistable region (shaded) expands as gamma changes, with beta is set constant at 1. |
As you can see in Figure 1, the region of bistability expands as one of the cooperativity constants (gamma, in this case) is increased. This shows that even if only one leg of our toggle switch has high cooperativity, then there is still an increase in the area of parameter space where we can get bistable or toggling behavior.
Toggle Switch 2.0: Extending the Gardner Model
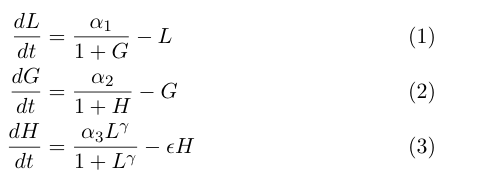
The model by Gardner, et al was a really useful starting point for modeling a toggle switch, but since our switch will be built using heterochromatin, we decided to extend the model slightly to incorporate the additional step of heterochromatin formation. To do this, we first derived equations very similar to those in the Gardner model:
Equation (1) describes the transcriptional repression side of the toggle switch, e.g. Gal80 represses the expression of LexA-Sir2. Equation (2) describes the effective repression due to the presence of heterochromatin, e.g. the silencing of Gal80 expression. Equation (3) describes the formation of heterochromatin when the nucleator (LexA-Sir2) is present. Note that in this set of equations, we assume no cooperativity in equations (1) and (2).
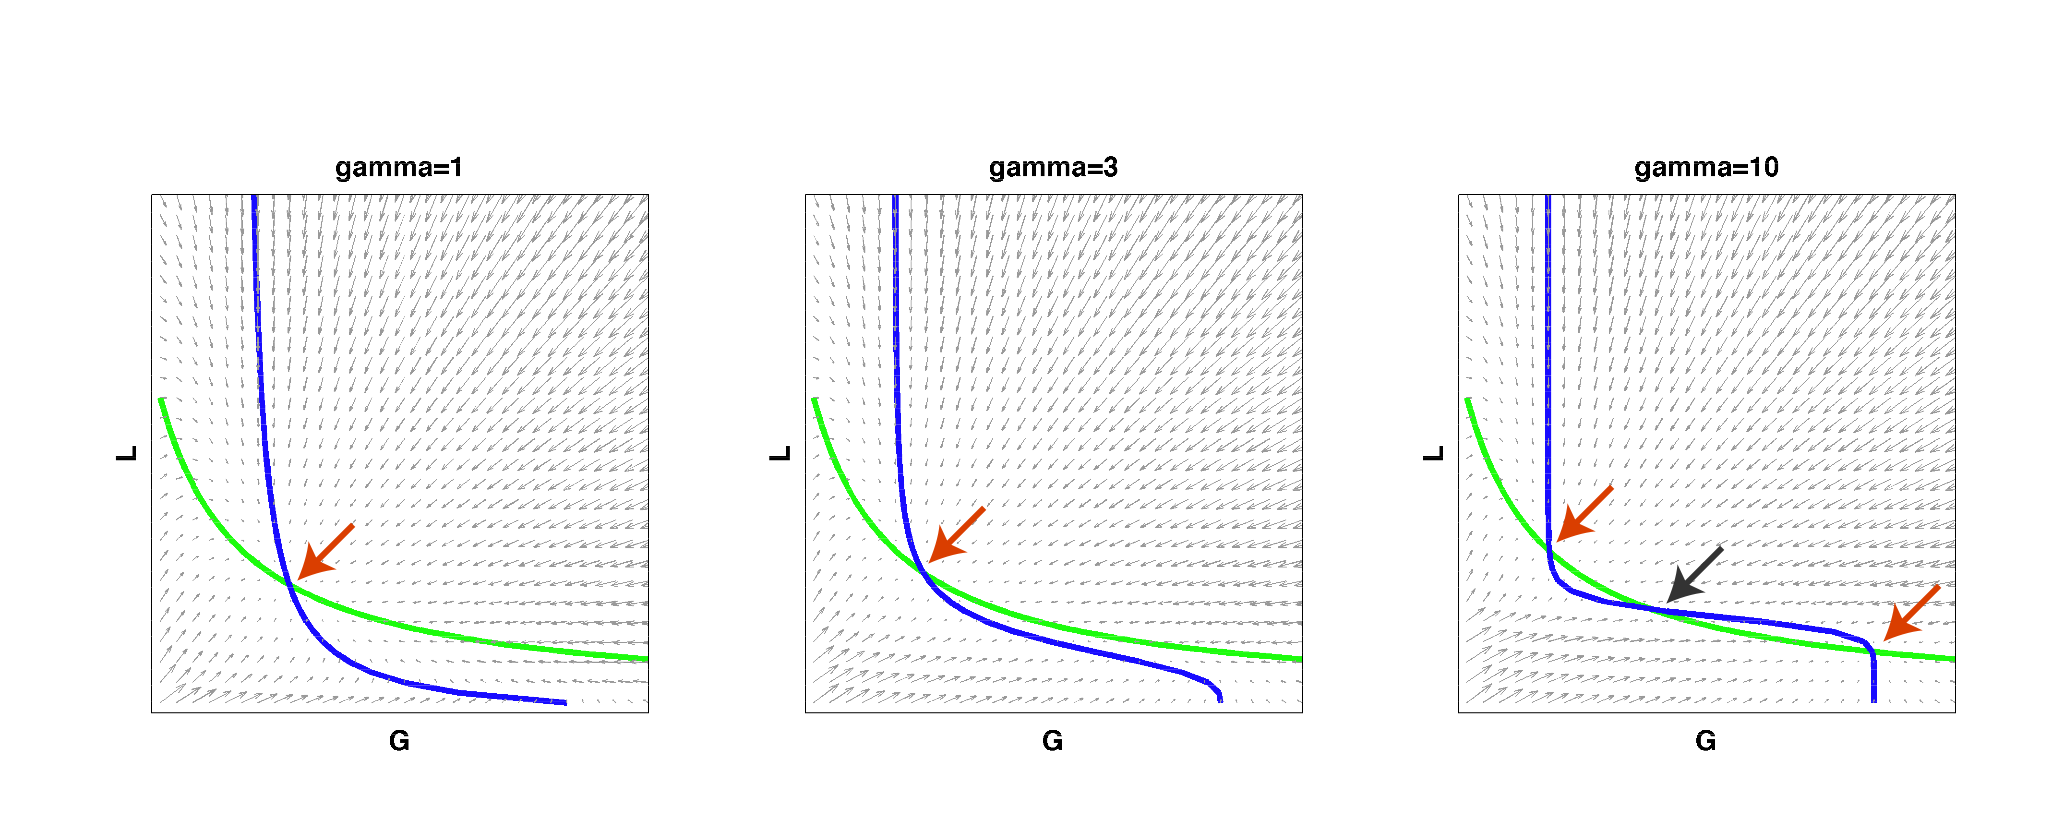
We then implemented this model in Matlab and analyzed it by solving for the null clines (steady state solutions) of the system:
| Figure 2: Null clines of the toggle-switch system as gamma increases. The red arrows indicate stable steady states. The black arrow indicates an unstable steady state. Note that bistability can be achieved with a high gamma even if such behavior is not observed at low gamma values, for the same set of parameter values. |
As you can see from the above figure, for a certain set of parameters, a system may start out as having only a single steady state at low gamma values, i.e. it cannot behave as a toggle switch. As gamma is increased to a high value, the null clines can begin changing shape so that multiple steady states exist and the system can then become bistable. This simple result reconfirmed that high effective cooperativity (e.g. in heterochromatin formation) can result in bistable behavior in a larger region of parameter space.
Although we liked this set of equations as a model of a heterochromatin-based toggle due to its simplicity and because it's a logical extension of the Gardner model, we realized that it has various problems. The fact that we're modeling heterochromatin as a concentration and using a transcriptional activation equation to describe the formation of heterochromatin seemed inappropriate to us. So for our next task, we focused on deriving a somewhat more realistic model for describing heterochromatin formation.
Heterochromatin Formation Like Polymerization?
So how does heterochromatin achieve such a high cooperativity? Traditionally, it's thought that the high cooperativity is due to the spreading of heterochromatin from an initiation site. To us, this sounds awfully similar to the process of nucleation and polymerization, so we thought it might be interesting to try to come up with a model for heterochromatin formation based on a simple polymerization model. (This work was inspired by a derivation of cytoskeletal polymers in "Physical Biology of the Cell" by Phillips, Kondev, and Theriot, which is not yet published.)
If we think of formation of heterochromatin as similar to the assembly of a protein polymer, we can write a set of reactions starting from empty DNA (H0) and LexA-Sir2 (L) initially binding to form an initiation complex. Then addition of S molecules increases the length of the heterochromatin "polymer":
where S denotes the components involved in heterochromatin elongation (the pool of LexA-Sir2 plus endogenous Sir2). Because we will be solving this model deterministically, we will also need to set an arbitrary maximum length N to analyze. (We also discussed implementing a stochastic model where we can let N go to infinity, but did not complete this within the timeframe of iGEM.)
At time t, there is a probability distribution describing the heterochromatin length
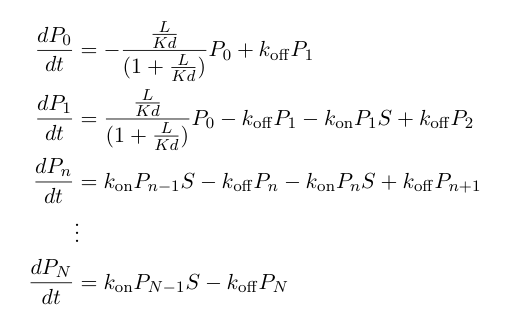
These probabilities vary with time, so we can write a set of differential equations based on the rate of formation/loss of polymers of a specific length:
Now, we can add in equations describing the rest of the synthetic heterochromatin-based toggle circuit and implement the model in Matlab to observe its behavior:
The first equation above describes the transcriptional repression leg of the switch, e.g. Gal80 represses the expression of LexA-Sir2. We've added an additional point of control here by including galactose as a possible input to "flip" the switch through repressing the transcriptional repression. The second equation describes the silencing by heterochromatin, where we are making the assumption that once the expected length of heterochromatin (as calculated from the probability distribution derived earlier in this section) is greater than a certain length threshold, the Gal80 gene is completely silenced and is no longer being expressed.
For a specific set of parameters, we can solve the differential equations in Matlab and plot the concentrations as a function of time.
| Figure 3: Time behavior of heterochromatin polymerization model. The system starts in a high Gal80/low LexA state. Upon addition of galactose, the toggle switch is flipped to a high LexA/low Gal80 state. |
In the plot above, we can see that initially, the system is set to a high Gal80/low LexA state. When we add the input galactose which represses the repression of Gal80 on LexA-Sir2, the system starts expressing LexA-Sir2 and eventually, the toggle switch is flipped to and remains in a state with high LexA/low Gal80.
| Home | The Team | The Project | Parts Submitted to the Registry | Modeling | Human Practices | Notebooks |
|---|
 "
"
