Team:Edinburgh/Results/Glycogen1
From 2008.igem.org
| Line 1: | Line 1: | ||
<div id="header">{{Template:Team:Edinburgh/Templates/Header}}</div> | <div id="header">{{Template:Team:Edinburgh/Templates/Header}}</div> | ||
| - | '''[[Team:Edinburgh/Results/Glycogen1|< Previous | + | '''[[Team:Edinburgh/Results/Glycogen1|< Previous Assay]] | [[Team:Edinburgh/Results|Back to Results]] | [[Team:Edinburgh/Results/Glycogen2|Next Assay >]]''' |
== Glycogen Assay 1 == | == Glycogen Assay 1 == | ||
| - | + | The first glycogen assay was performed only to gauge the usefulness of an iodine test. It simply involved adding Gram's iodine solution dropwise on to colonies grown on nutrient agar. Iodine solution stains glycogen resulting in a brown colour: a cell containing more glycogen will stain darker brown than a cell containing less glycogen. | |
| - | + | We grew ''E. coli'' on two different media, one which would encourage glycogen production and a second that would not. It has been documented that glycogen production is increased in ''E. coli'' cells by growth in a medium rich in a carbon source, so we made up the following plates: | |
# Nutrient agar | # Nutrient agar | ||
# Nutrient agar + 2% glucose | # Nutrient agar + 2% glucose | ||
| Line 14: | Line 14: | ||
[[Image:Edinburgh=Glycogen-Assay.jpg]] | [[Image:Edinburgh=Glycogen-Assay.jpg]] | ||
| - | This shows that the stain colony on the (+)glucose plate (a) is darker than the stained colony on the (-)glucose plate (b), indicating that the colony on the (+)glucose plate contains more glycogen than that on the (-)glucose plate. | + | This shows that the stain colony on the (+)glucose plate (a) is darker than the stained colony on the (-)glucose plate (b), indicating that the colony on the (+)glucose plate contains more glycogen than that on the (-)glucose plate. |
| + | |||
| + | These results were apparent after ~5 mins of staining. After ~30 mins of staining the colour began to diminish until no apparent difference could be seen between the two colonies, as can also be seen by the colony to the left of the circled colony on each plate in the figure. | ||
Latest revision as of 21:57, 27 October 2008
< Previous Assay | Back to Results | Next Assay >
Glycogen Assay 1
The first glycogen assay was performed only to gauge the usefulness of an iodine test. It simply involved adding Gram's iodine solution dropwise on to colonies grown on nutrient agar. Iodine solution stains glycogen resulting in a brown colour: a cell containing more glycogen will stain darker brown than a cell containing less glycogen.
We grew E. coli on two different media, one which would encourage glycogen production and a second that would not. It has been documented that glycogen production is increased in E. coli cells by growth in a medium rich in a carbon source, so we made up the following plates:
- Nutrient agar
- Nutrient agar + 2% glucose
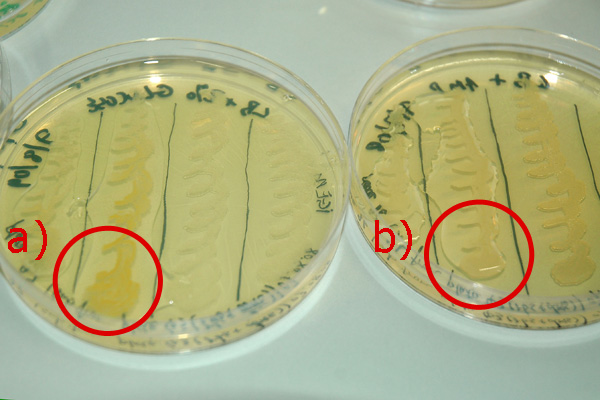
Results of the staining of colonies on these two plates are as follows:
This shows that the stain colony on the (+)glucose plate (a) is darker than the stained colony on the (-)glucose plate (b), indicating that the colony on the (+)glucose plate contains more glycogen than that on the (-)glucose plate.
These results were apparent after ~5 mins of staining. After ~30 mins of staining the colour began to diminish until no apparent difference could be seen between the two colonies, as can also be seen by the colony to the left of the circled colony on each plate in the figure.
 "
"

