Team:Edinburgh/Results/Glycogen3
From 2008.igem.org
| Line 16: | Line 16: | ||
Results from [[Team:Edinburgh/Results/Glycogen2|Glycogen Assay 2 (Qualitative)]] were in line with these expectations. | Results from [[Team:Edinburgh/Results/Glycogen2|Glycogen Assay 2 (Qualitative)]] were in line with these expectations. | ||
| - | The three samples were analysed by Raman spectroscopy. Glycogen results in a peak at a Raman shift of 478cm<sup>-1</sup>, so the Raman intensity of this peak was measured for each sample. | + | The three samples were analysed by Raman spectroscopy to determine the glycogen:protein ratio. Glycogen results in a peak at a Raman shift of 478cm<sup>-1</sup>, so the Raman intensity of this peak was measured for each sample and compared to the Phenylalanine peak at 1003cm<sup>-1</sup>. |
=== Results === | === Results === | ||
| Line 22: | Line 22: | ||
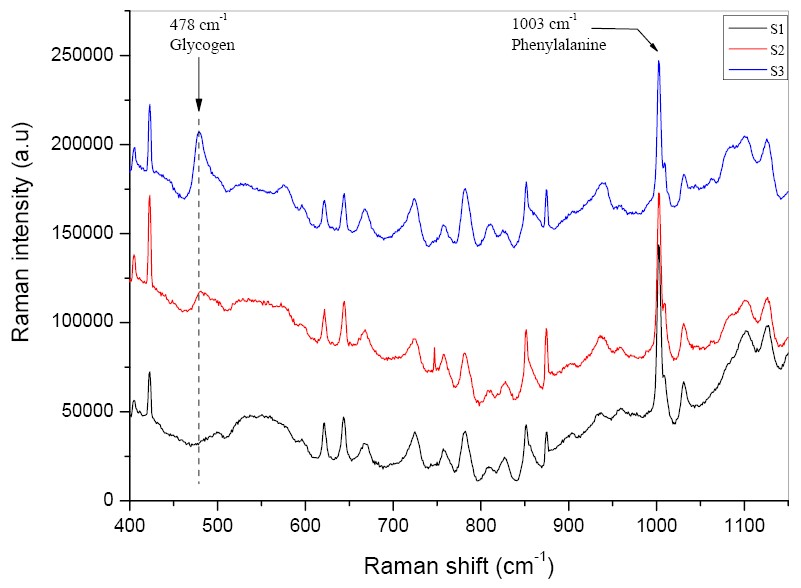
[[Image:Edinburgh%3DGlycogen-Assay3.jpg|500px]] | [[Image:Edinburgh%3DGlycogen-Assay3.jpg|500px]] | ||
| - | The results confirm our expectations. | + | The results confirm our expectations. Control cells (S1) produced the least amount of glycogen and ''glgC16'' cells grown in high-glucose medium (S3) the most. From the intensity of the glycogen peak, the concentration of glycogen in S3 is estimated to be 3~4 times more than in S2. |
We may thus conclude that the ''glgC16'' BioBrick results in significantly increased production of glycogen, especially in a high-glucose medium. | We may thus conclude that the ''glgC16'' BioBrick results in significantly increased production of glycogen, especially in a high-glucose medium. | ||
Revision as of 22:21, 27 October 2008
< Previous Assay | Back to Results | Next Assay >
Glycogen Assay 3 (Quantitative)
Raman spectroscopy was performed by Dr Rabah Mouras.
Experiment Design
This quantitative assay compared the amount of glycogen produced by:
- Sample 1 (Control): E. coli cells with no modification to the glycogen production system and grown in a medium which does not promote glycogen formation. These should have a low, basal level of glycogen.
- Sample 2: E. coli cells transformed with the glgC16 BioBrick but grown in a glucose-free medium. These should produce a higher level of glycogen than the control.
- Sample 3: E. coli cells transformed with the glgC16 Biobrick and grown in a high-glucose medium. These should produce the highest level of glycogen.
Results from Glycogen Assay 2 (Qualitative) were in line with these expectations.
The three samples were analysed by Raman spectroscopy to determine the glycogen:protein ratio. Glycogen results in a peak at a Raman shift of 478cm-1, so the Raman intensity of this peak was measured for each sample and compared to the Phenylalanine peak at 1003cm-1.
Results
The results confirm our expectations. Control cells (S1) produced the least amount of glycogen and glgC16 cells grown in high-glucose medium (S3) the most. From the intensity of the glycogen peak, the concentration of glycogen in S3 is estimated to be 3~4 times more than in S2.
We may thus conclude that the glgC16 BioBrick results in significantly increased production of glycogen, especially in a high-glucose medium.
 "
"

