Team:Imperial College/Genetic Circuit

From 2008.igem.org

(Difference between revisions)
Line 103: Line 103:
[[Media:InduciblePromoter.m|Simulation File]]
[[Media:InduciblePromoter.m|Simulation File]]
-
|[[Image:SimpleModel_2.jpg|thumb|300px|Pre-steady-state time evolution of GFP using the simple model.]]<br>[[Image:ComplexModel2.jpg|thumb|300 px|Pre-steady-state time evolution of GFP using the more sophisticated model.]]}}
+
|[[Image:SimpleModel_2.jpg|thumb|300px|Pre-steady-state time evolution of GFP using the simple model.]]<br>[[Image:ComplexModel3.jpg|thumb|300 px|Pre-steady-state time evolution of GFP using the more sophisticated model.]]}}
{{Imperial/Box2||
{{Imperial/Box2||

Revision as of 15:46, 28 October 2008

Modelling the Genetic Circuit

An accurate mathematical description of the genetic circuit is essential for projects involving synthetic biology. Such descriptions are an integral component of part submission to the Registry, as exemplified by the canonical characterisation of part F2620 (1). The ability to capture part behaviour as a mathematical relationship between input and output is useful for future re-use of the part and modification of integration into novel genetic circuits.


Modelling Constitutive Gene Expression


A simple synthesis-degradation model is assumed for the modelling of the expression of a protein under the control of a constitutive promoter, with the same model assumed for all four promoter-RBS constructs. The synthesis-degradation model assumes a steady state level of mRNA.

Eq1.png

In this case, [protein] represents the concentration of GFP, k1 represents the rate of sythesis and d1 represents the degradation rate. We can easily simulate this synthesis-degradation model using matlab:
ODE
Simulation File

We can also solve this ODE analytically.

Eq analytical soln constitutive expression.png

Consider the steady-state behaviour of [protein].

Eq2.png

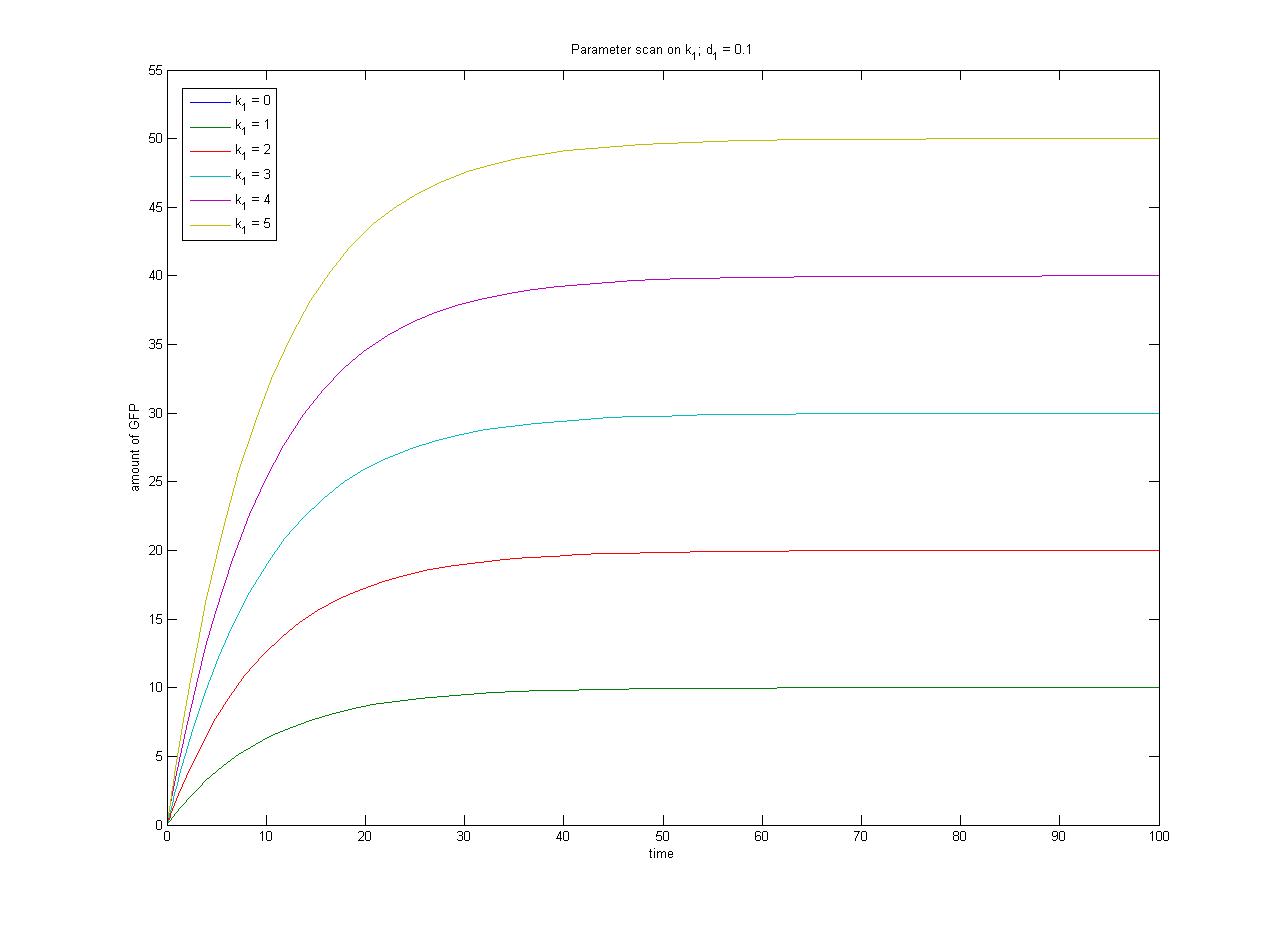
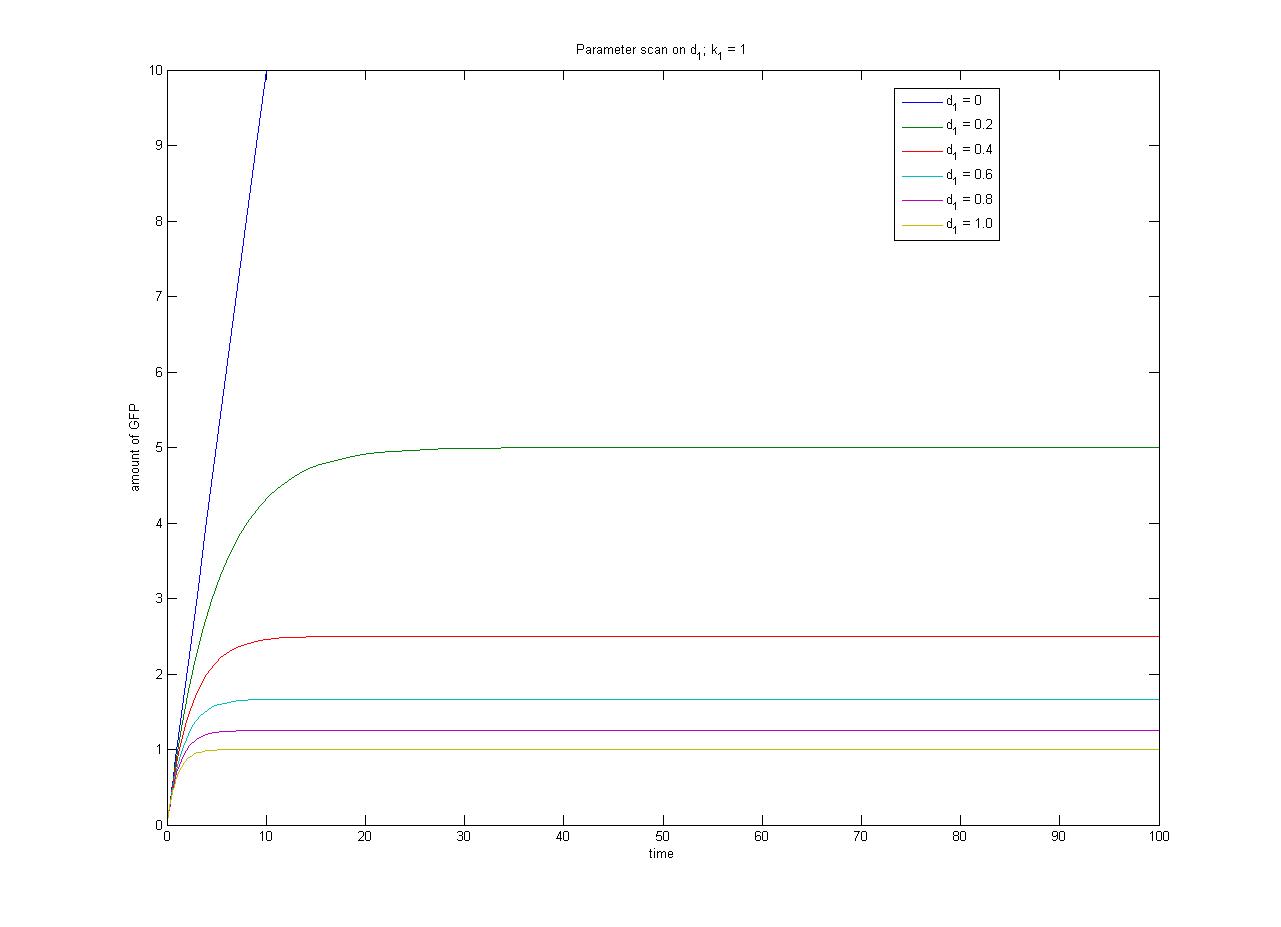
The relationship between the steady-state protein concentration and the parameters can be seen in the parameter scan graphs on the right.

Note from the parameter scan graphs:

  • In the case where k1 = 0, no GFP is sythesised.
  • In the case where d1 = 0, the concentration of protein does not reach a steady state.

From the wetlab experiments it is likely that we will obtain steady-state data for each of the four promoter-RBS constructs. If we assume the same rate of degradation of GFP in each case, we can use the relative steady-state levels of GFP as a proxy for the relative rate of transcription through each promoter. This will help us with the selection of the most appropriate promoter to use for Phase 2. In order to obtain an absolute measure of transcription (as opposed to a relative measure of transcriptional strength) we require constitutive expression in terms of molecules per cell (as opposed to fluorescence in arbitrary units).

Complementary experiments to estimate the rate of degradation of GFP - by terminating transcription - would allow us to estimate absolute rate of transcription through each promoter.


Constitutive expression of antibiotic resistance (AB) and GFP. GFP brick is part E0040, GFPmut3b. Terminator is part B0015, the double-stop.

A simple model of inducible gene expression PRE-INDUCTION (NO IPTG PARTICIPATING IN THE REACTION)


IPTG is an inducer which binds to LacI. LacI is a repressor that is constitutively expressed. It binds to the promoter preventing the promoter from expressing an output, in this case GFP.


In the absence of IPTG , LacI is constitutively expressed. At the same time, it can bind to the promoter to repress it.

Repressor is constitutively expressed. Hence the constitutive expression model from the previous characterisation step can be assumed.

Eq3.png

The repressor only binds to the promoter when it is in its unbound form. Hence the transcription will be a function of free repressor concentration.

Eq5.png

Simulation file: loadup.m Evolution of :

  • Concentration of free promoters
  • Concentration of LacI
  • Concentration of P-LacI complex
  • Concentration of Fluorescent Protein

Give expression for the steady state of the ODE system InduciblePromoter_ODE.asv

Final Comment : There is a basal rate of GFP – leakiness Even when LacI binds to the promoter, which results in repression, there is still some sort of expression, hence the leakiness of GFP. The LacI does not completely repress the promoter.


--Mabult 14:44, 27 October 2008 (UTC) Cut this part out and move it into Pridence's section (simple repression Model)

Two models of IPTG-induced expression of GFP under the control of the Plac promoter


A literature search revealed two models of IPTG-induced expression through the Plac promoter. Both models assume constitutive expression of LacI. Before IPTG is added, a steady-state is reached comprising basal (leaky) expression of GFP.

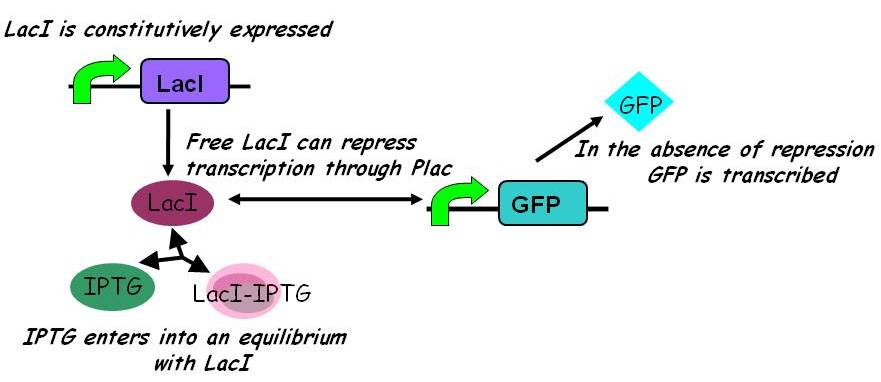
In the simpler model (2) IPTG competes with free promoter for LacI binding, but does not itself bind to the LacI-promoter complex.
Igem2008 - inducible promoters.jpg

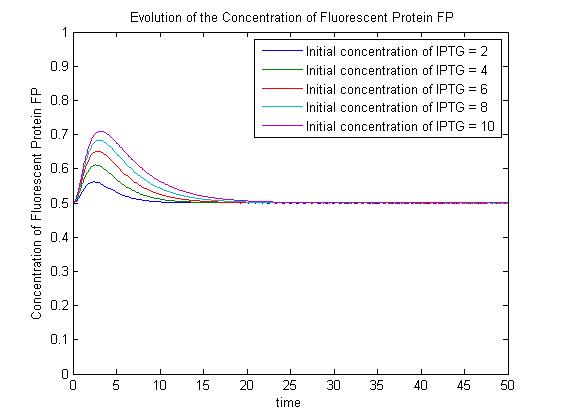
Assuming this model, all else equal, the steady-state concentration of free promoter and hence the steady-state concentration of GFP are independent of the initial concentration of IPTG. (See time evolution of GFP expression assuming different concentrations of IPTG are used for induction, right.)

ODEs
Simulation File

The pre-steady-state dynamic behaviour of the GFP concentration will differ with different initial concentrations of IPTG (but the steady-state behaviour will not). Hence, accuarate data collection during the pre-steady-state phase is crucial for parameter estimation.

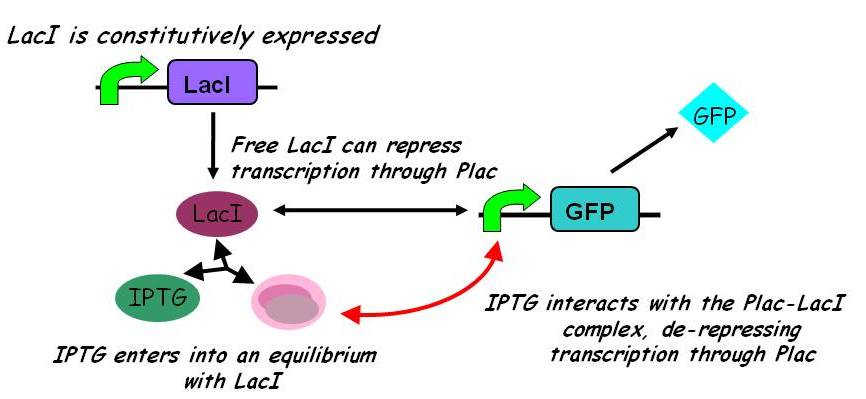
A more sophisticated model allows for interaction between IPTG and the promoter-LacI complex (3). IPTG can bind to the promoter-LacI complex to form IPTG-LacI and free promoter. This eases the repression by LacI and allows transcription of GFP.
Inducible promoters 2.jpg

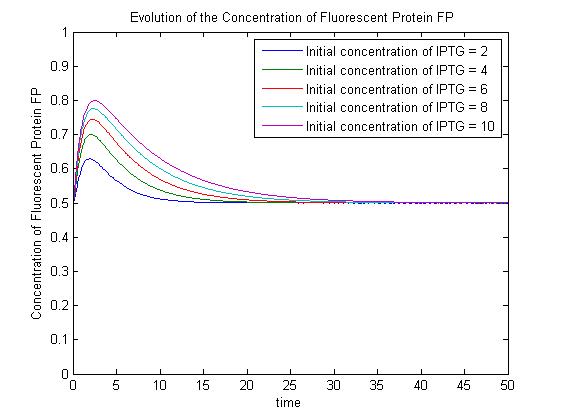
Under this model, the dynamic behaviour (whether or not [GFP] attains a maximum higher than its steady-state value) depends on the relative strengths of the kinetic constants describing the interactions underlying the model. Either way, all else equal the steady-state [GFP] will vary as a Hill-function dependent on the initial concentration of IPTG; this characteristic can be used to discriminate between the two models.

ODEs
Simulation File


Pre-steady-state time evolution of GFP using the simple model.

Pre-steady-state time evolution of GFP using the more sophisticated model.

References
  1. Canton B, Labno A, & Endy D (2008) Refinement and standardization of synthetic biological parts and devices. - Nature biotechnology 26 (7) 787-793
  2. Kuhlman T, Zhang Z, Saier MH Jr, & Hwa T (2007) Combinatorial transcriptional control of the lactose operon of Escherichia coli. - PNAS 104 (14) 6043-6048
  3. Alon, U (2006) An Introduction to Systems Biology: Design Principles of Biological Circuits - Chapman & Hall/Crc Mathematical and Computational Biology