Team:NTU-Singapore/Modelling/ODE
From 2008.igem.org
Lalala8585 (Talk | contribs) |
Lalala8585 (Talk | contribs) |
||
| Line 50: | Line 50: | ||
==Regulated Transcription== | ==Regulated Transcription== | ||
| - | [[Image:Regulated1.JPG| | + | [[Image:Regulated1.JPG|260px|Regulated1]]<br> |
[P]: Protein Formed<br> | [P]: Protein Formed<br> | ||
| Line 61: | Line 61: | ||
a: correlation between k1 and k, 0<a<1<br> | a: correlation between k1 and k, 0<a<1<br> | ||
| - | [[Image:Regulated2.JPG| | + | [[Image:Regulated2.JPG|280px|Regulated2]]<br> |
This ODE attempts to capture characteristics of the mRNA dynamics<br> | This ODE attempts to capture characteristics of the mRNA dynamics<br> | ||
For our modeling, all our detection systems activates some form of transcription. Therefore µ=1 in all cases for our modeling exercise. | For our modeling, all our detection systems activates some form of transcription. Therefore µ=1 in all cases for our modeling exercise. | ||
| Line 82: | Line 82: | ||
U : system input<br> | U : system input<br> | ||
d1A : degradation constant for mRNA<br> | d1A : degradation constant for mRNA<br> | ||
| + | |||
| + | #* Translation of LacI Protein | ||
| + | [[Image:Lac2.JPG |200px|Lac2]]<br> | ||
| + | [PA] : Protein concentration<br> | ||
| + | k2A : kinetic constant of translation<br> | ||
| + | d2A : degradation constant for Protein<br> | ||
| + | |||
| + | #Complex formation between LacI and Lactose | ||
| + | [[Image:Complex1.JPG |300px|Complex]]<br> | ||
| + | [ComAB] : Complex of LacI and Lactose<br> | ||
| + | K3AB : Rate constant of complex formation<br> | ||
| + | [PA]o : Protein concentration of LacI at the time of Lactose addition<br> | ||
| + | [B]o : Initial concentration of Lactose<br> | ||
| + | |||
| + | #E7 production | ||
| + | #* Transcription of E7 gene mRNA | ||
| + | [[Image:E71.JPG |300px|E71]]<br> | ||
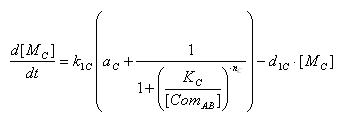
| + | [MC]: E7 mRNA Concentration<br> | ||
| + | k1C: kinetic constant of transcription<br> | ||
| + | a : constitutive portion , 0<a<1<br> | ||
| + | KC: Hill constant<br> | ||
| + | nC: Hill coefficient<br> | ||
| + | d1C: degradation constant for mRNA<br> | ||
| + | |||
| + | #* Translation of E7 Protein | ||
| + | [[Image:E72.JPG |200px|E72]]<br> | ||
| + | [PC] : Protein concentration<br> | ||
| + | k2C : kinetic constant of translation<br> | ||
| + | d2C : degradation constant for Protein<br> | ||
==Iron and Ai2 controlled production of Lysis== | ==Iron and Ai2 controlled production of Lysis== | ||
Revision as of 01:42, 26 June 2008
|
Contents |
ODEs used in modeling
The following equations shows the break down of the different equations that will be used in this modeling exercise. By understanding this section, it would make the understanding of the system of ODEs used
Constant synthesis & Linear Synthesis
- Simple ode to describe constant synthesis
- Gives an explicit analytical solution
- Unique solution once a IC is posed
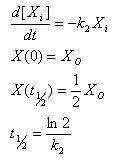
Linear Degradation
- Rate of degradation is proportional to how much of the molecule is present
- Gives an explicit analytical solution
- Constant half life
Simple Forward Reaction
[C] : Complex
kc : Rate constant of complex formation
This equation ignores the fact that dissociation of the complex occurs. We can do so if the dissociation is much slower than the formation.
- Single solvable equation for the unknown C
- Simple, unique solution available with I.C
Phosphorylation and Dephosphorylation
Assumptions:
- Linear kintic rate laws apply only if XT is much less than the Michaelis constants of both kinase and phosphotase
XT : total cost of X protein in phosphorylated and unphosphorylated form
S : protein kinase concentration
k2 : accounts for protein phosphotase
- Modeled after simple linear kinetics
- Gives a hyperbolic signal response curve when X plotted vs S
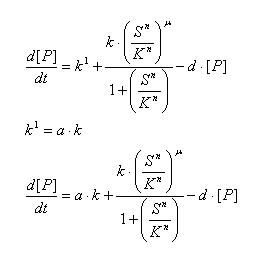
Regulated Transcription
[P]: Protein Formed
µ: Repression, µ=0;
Activation, µ=1
K: Hill Constant Value of input that gives 50% response
n: Hill coefficient Slope of signal-response curve at this input signal
d: degradation of protein
k1: basal gene expression
k: signal-dependent gene expression
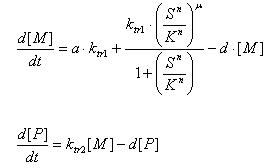
a: correlation between k1 and k, 0<a<1
This ODE attempts to capture characteristics of the mRNA dynamics
For our modeling, all our detection systems activates some form of transcription. Therefore µ=1 in all cases for our modeling exercise.
ODE system used in model
Lactose controlled production of E7 + Imm
Variables
- LacI = A
- Lactose =B
- E7 = C
- LacI production
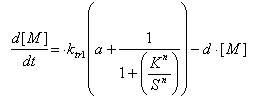
- Transcription of LacI gene mRNA
[MA] : LacI mRNA concentration
k1A : kinetic constant of transcription
U : system input
d1A : degradation constant for mRNA
- Translation of LacI Protein
[PA] : Protein concentration
k2A : kinetic constant of translation
d2A : degradation constant for Protein
- Complex formation between LacI and Lactose
[ComAB] : Complex of LacI and Lactose
K3AB : Rate constant of complex formation
[PA]o : Protein concentration of LacI at the time of Lactose addition
[B]o : Initial concentration of Lactose
- E7 production
- Transcription of E7 gene mRNA
[MC]: E7 mRNA Concentration
k1C: kinetic constant of transcription
a : constitutive portion , 0<a<1
KC: Hill constant
nC: Hill coefficient
d1C: degradation constant for mRNA
- Translation of E7 Protein
[PC] : Protein concentration
k2C : kinetic constant of translation
d2C : degradation constant for Protein
Iron and Ai2 controlled production of Lysis
Variables
Variables
- Ai-2 : A
- ai-2-phos : B
- LsrR : C
- SupD derivatives : D
- T7ptag : E
- Lysis : F
 "
"


